The first step of working with data is to get to know your corpus. Our project, for instance, is most concerned with the linguistic and humanistic contexts in the Twitter discourses generated by the Covid-19 pandemic. Some starting “get-to-know-you” questions we are interested in about our corpus include the trend of daily corpus length, most frequently used words, term co-occurrence, and corpus comparisons by time, locations, and languages.
The large size of data makes manual reading merely impossible. Machine learning, thankfully, assists humanists in understanding key characters of the corpus and, in turn, developing analytical questions for research. Employing digital methods, however, in the humanities does not equate replacing human reading with software. The computer can make otherwise time-consuming, or unimaginable, tasks feasible by showing relationships and patterns in big data. Digital humanists then apply critical analysis and expertise in the humanities to attempt to make sense of these patterns and their broader implications. In other words, machines provide a new method to observe crucial information about large-scale texts that manual reading alone cannot accomplish or detect. The results machines generate is just the beginning of every DH project instead of the output. Human analysis and humanities knowledge remain at the core of DH scholarship.
Voyant is one of the tools we use to capture a snapshot of our corpus. It is a web-based software for large-scale text analysis, including functions of corpus comparisons, counting word frequencies, analyzing co-occurrence, interpreting key topics, etc. It does not require installment and is compatible with most machines. Here is a tutorial, or rather an experiment, of working with Voyant to conduct initial textual explorations with our corpus, updated on a daily basis and available at: https://github.com/dh-miami/narratives_covid19/tree/master/twitter-corpus (check our previous post on Hydrating TweetingSets)
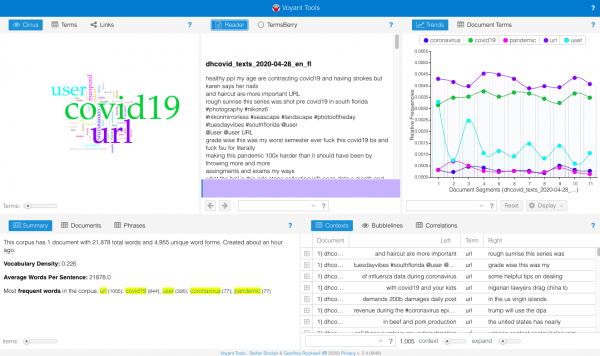
For this tutorial, we selected the English corpus in Florida on April 28, 2020, the day total cases in the U.S. reached the one million mark. Voyant reads plain text (txt.) files either by pasting in the dialogue box or uploading your file. Here are the initial results we got after uploading the hydrated corpus.
Beginning by reading the summary, we know that on April 28, our corpus consists of 21,878 words, of which 4,955 are unique. Vocabulary density is calculated by dividing the number of unique words by the number of total words. The closer to 1 the denser and diverse the corpus is. With a density index number of 0.226, we can know that the corpus is not so diverse on April 28. Once we run tests on the entire collection of our data we will then make sense of whether this density is a norm throughout the entire corpus or a significant finding.
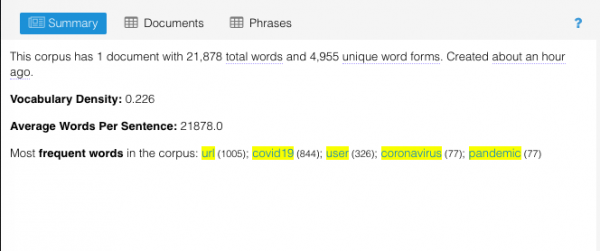
We can also see that empty words, such as “user” and “url,” which are in every Twitter document and do not hold any significance, are distracting the results of most frequent words as well as the cirrus. We can remove these terms by clicking “define options for this tool” on the top-right corner of the cirrus box and by editing the stop word list. Voyant has the function to automatically detect and remove a default list of stop words. To keep a clear record of your results, it is best to keep a list of the words you remove. Here is the new cirrus graph after removing “user” and “url.”
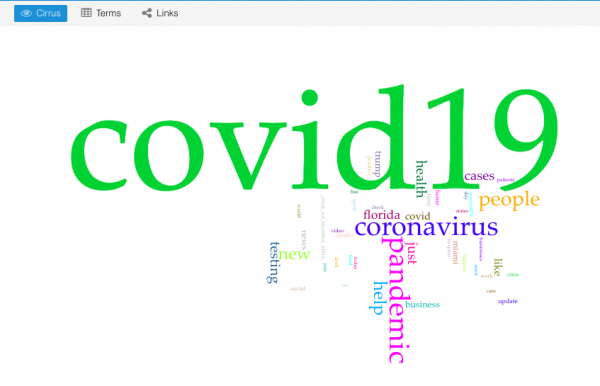
The top 5 most frequent words in the corpus are “covid19” (844 counts,) “coronavirus” (77 counts,) “pandemic” (77 counts,) “people” (57 counts,) and “help” (51 counts.) Since our entire collection of tweets are about the Covid-19 pandemic, words include “covid19,” “coronavirus,” and “pandemic” are likely to appear in most daily corpus. To get a closer look at what the corpus on April 28 looks like, we removed these consistent thematic words and generated a new cirrus graph.
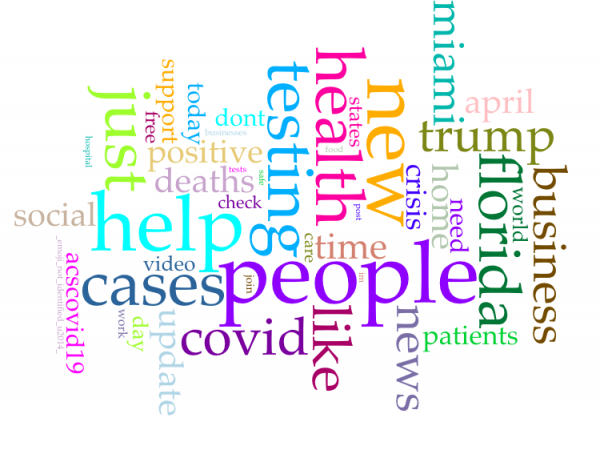
The new top 5 most frequent words are “people” (57 counts,) “help” (51 counts,) “new” (45 counts,) “just”(44 counts,) and “testing” (44 counts.) Based on these words we can speculate that new cases and testing related topics took a significant portion of the April 28 data. We will keep track of the daily most frequent words, explore other Voyant features, and analyze the larger trend for the next steps.