La primera etapa del trabajo con datos es conocer con qué corpus se va a trabajar. Nuestro proyecto, por ejemplo, se interesa especialmente por el contexto lingüístico y humanístico sobre el discurso que se generó en Twitter debido a la pandemia de Covid-19. Algunas preguntas que nos hicimos, desde el inicio, incluyen la proporción de información diaria acerca del corpus, las palabras más utilizadas, la ocurrencia de términos y la comparación cronológica, geográfica y lingüística.
El enorme volumen de datos hace que la lectura humana sea imposible. Afortunadamente, el aprendizaje automático contribuye a que los humanistas comprendan aspectos fundamentales del corpus y, que puedan desarrollar preguntas más críticas para la investigación. Sin embargo, emplear métodos digitales en las Humanidades no equivale a reemplazar con software la lectura humana. La informática hace factible operaciones que de otro modo requerirían mucho tiempo o serían inimaginables, mostrando relaciones y patrones de un gran volumen de datos. Por lo cual, los humanistas digitales aplican el análisis crítico y su experticia en las Humanidades para procurar que estos patrones y sus implicaciones tengan sentido. En otras palabras, a través de las computadoras podemos trabajar en un método de reconocimiento de información esencial sobre grandes volúmenes de texto que la lectura manual no puede alcanzar o detectar por sí sola. Los resultados que se generan son solo el comienzo de cada proyecto de HD y no el resultado final. El análisis humano y el conocimiento de Humanidades siguen siendo el núcleo de la labor en HD.
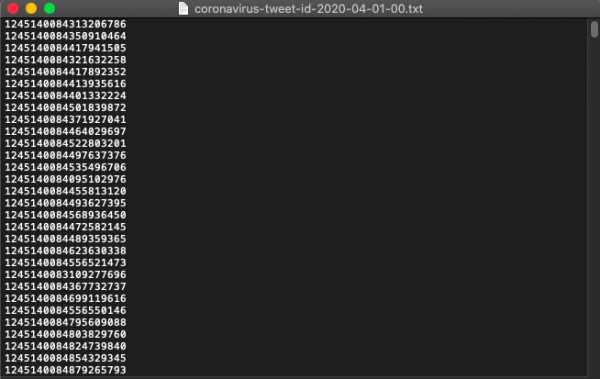
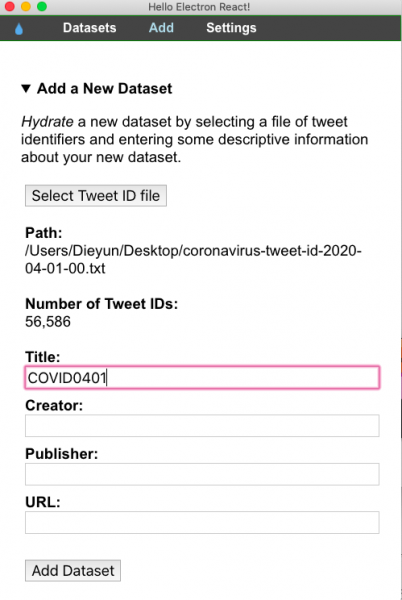
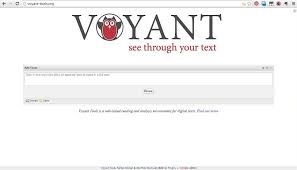
Voyant Tools es una de las herramientas que utilizamos para obtener una vista general de nuestro corpus. Se trata de un software en línea, útil para el análisis de grandes cantidades de textos, que cuenta con funciones como la comparación de corpus, cuantificación de frecuencia de palabras, análisis de ocurrencias, interpretación de términos clave, etc. No requiere instalación y es compatible con la mayoría de los sistemas operativos. A continuación, se presenta un ejemplo, o más bien un ensayo del trabajo con Voyant Tools para llevar a cabo las primeras exploraciones textuales con nuestro corpus, que se actualiza diariamente y se encuentra disponible en https://github.com/dh-miami/narratives_covid19/tree/master/twitter-corpus (consulta nuestro anterior post en ¿Cómo hidratar un conjunto de Tweets?).
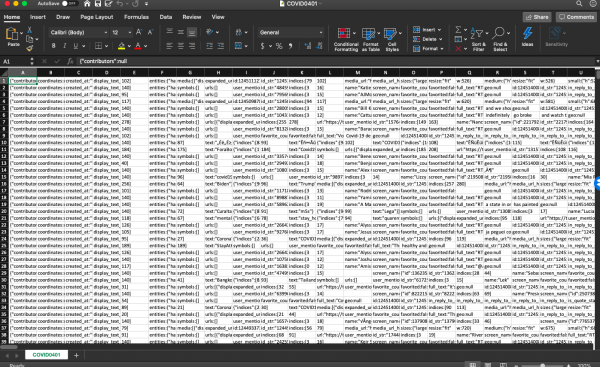
Para ello, seleccionamos el corpus de tweets en inglés sobre Florida del 28 de abril de 2020, el día en que el total de casos en los EE. UU. alcanzó el millón. Voyant Tools lee archivos de texto plano (txt.) ya sea pegándolo en el cuadro de diálogo o subiendo un archivo. Los resultados que obtuvimos después de subir el corpus hidratado son los siguientes:
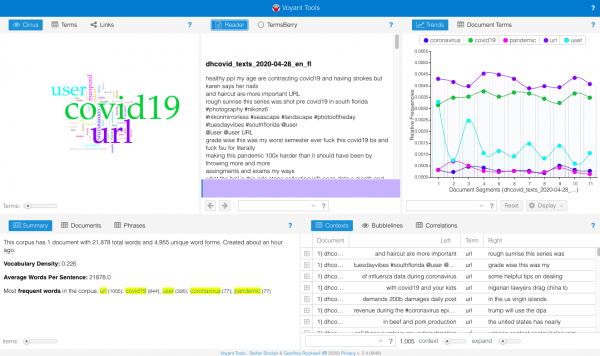
A partir de la lectura del resumen, sabemos que el 28 de abril, nuestro corpus consta de 21.878 palabras, de las cuales 4.955 son únicas. La densidad del vocabulario se calcula dividiendo el número de palabras únicas por el número de palabras totales. Cuanto más cerca de 1, más denso y diverso es el corpus. Con un índice de densidad de 0,226, podemos saber que el corpus no es tan diverso a esa fecha. Una vez que ejecutemos las evaluaciones de toda la muestra de nuestros datos, comprenderemos si esta densidad es una norma en todo el corpus o un hallazgo significativo.
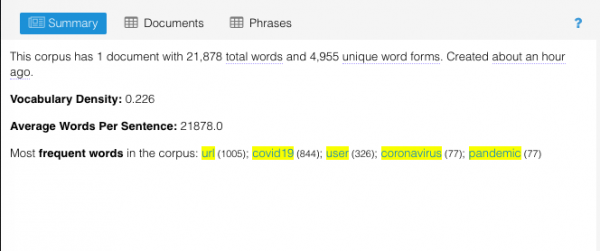
Asimismo, podemos ver que las palabras, como user y url, que figuran en todos los textos de Twitter no poseen significado alguno, y solo distraen los resultados de las más frecuentes, así como los cirrus. Podemos remover estos términos haciendo clic en definir opciones para esta herramienta en la esquina superior derecha del cuadro de cirrus, editando la lista de palabras excluidas. Voyant dispone de una lista predeterminada de palabras excluidas (stopwords): esta función detecta y elimina automáticamente dichos términos. Para llevar un registro de sus resultados, es mejor mantener una lista propia de las palabras suprimidas.
El siguiente es el nuevo cirrus después de eliminar user y url.
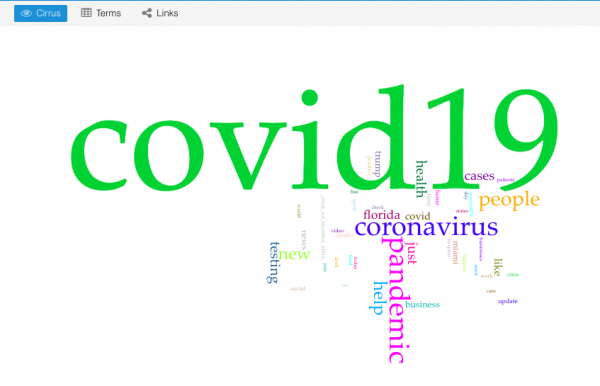
Las 5 palabras más frecuentes en el corpus fueron “covid19” (844 ocurrencias), “coronavirus” (77), “pandemic” (77), “people” (57) y “help” (51 ocurrencias). Como nuestra colección completa de tweets trata sobre la pandemia Covid-19, es probable que las palabras “covid19”, “coronavirus” y “pandemic” aparezcan en la mayoría de los corpus diarios. Para ver más de cerca el aspecto del 28 de abril, eliminamos estos términos y generamos un nuevo gráfico de cirrus.
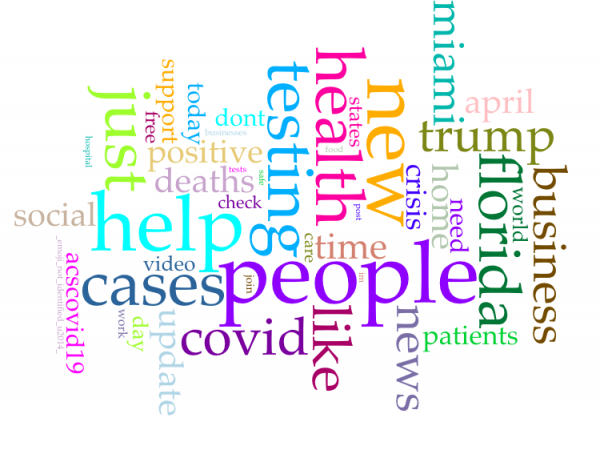
Finalmente, estas son las 5 palabras más frecuentes: “people” (57 registros), “help” (51), “new” (45), “just”(44 ) y “testing” (44 registros). Basándonos en estas palabras, podemos especular que los nuevos casos y los temas relacionados con los testeos fueron una parte significativa en las conversaciones del 28 de abril. En nuestros próximos posteos, seguiremos registrando las palabras más frecuentes de cada día y analizando otras funcionalidades de Voyant Tools.