The Coveet.py is hosted in our GitHub repository of the Digital Narratives of Covid-19 project.
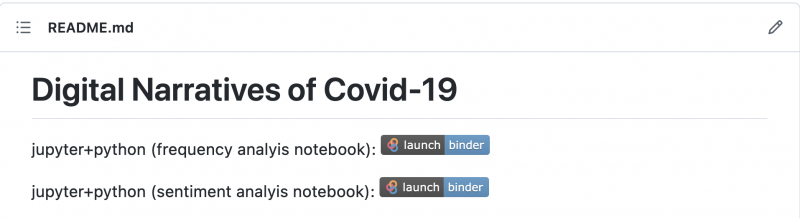
In the main page of the repository, https://github.com/dh-miami/narratives_covid19, there are two different buttons that allow to run a Binder environment: one of them launches the Frequency analysis Jupyter notebook, and the other one the Sentiment Analysis script.
Let’s first launch the Frequency Analysis by clicking to the “launch | binder”:
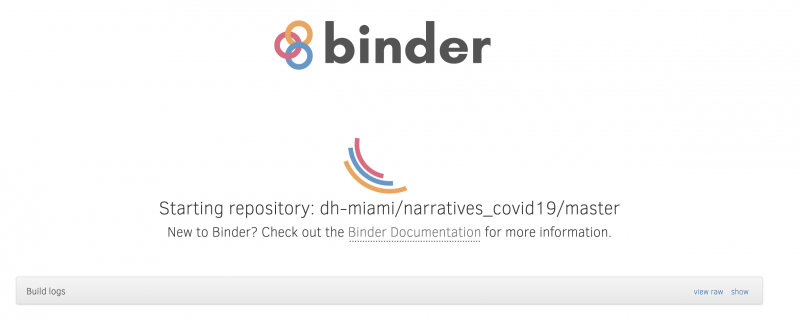
The Binder platform will open up and it can take some minutes to prepare:
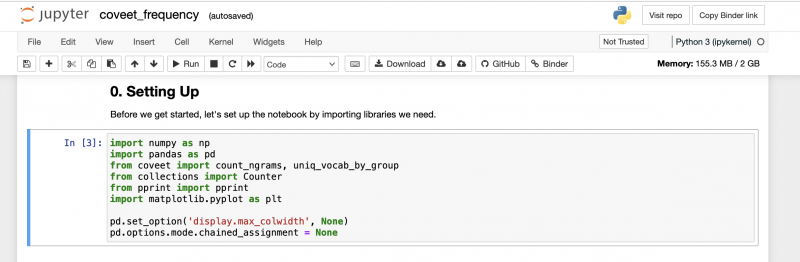
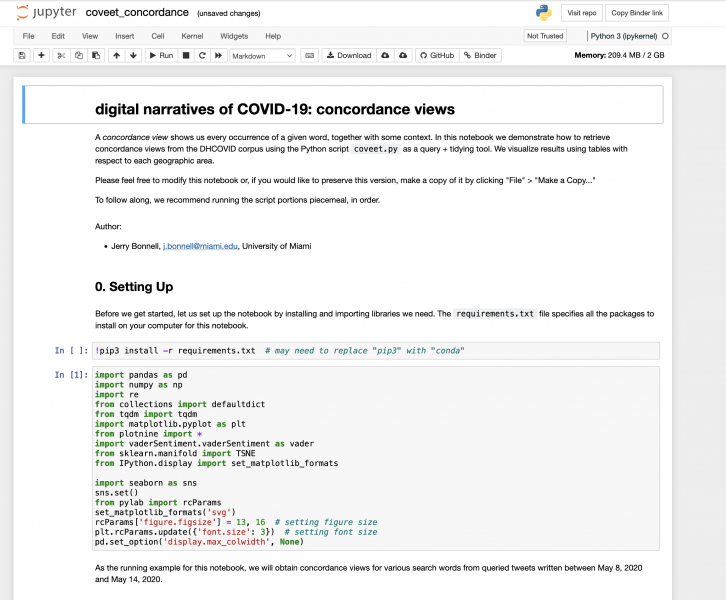
Once is ready, you will see the Jupyter notebook, and you can start running the code. Read carefully all the narrative and try running every one of the chunks of code:
Once the set up is complete (0. Setting Up), the first step begins. The first time you can try running the code as is, but the idea is everyone can customize the query following their research interests:
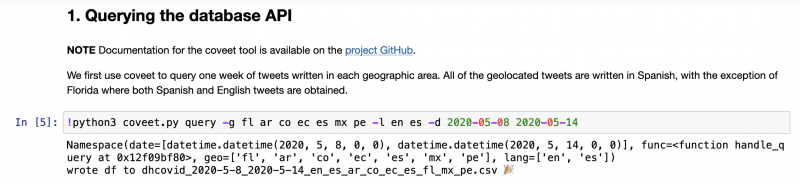
-g stands for geography and -l language, so you will need to change the query code. If you want all tweets from Ecuador in Spanish from May 2020 until July 2021, the query will need to be: !python3 coveet.py query -g ec -l es -d 2020-05-01 2020-07-31 This query would then create a file called dhcovid_2020-5-1_2020-7-30_es_ec.csv
It is important that you run a chunk of code at at a time and wait that it appears a number between brackets. If you see the asteriks [*] means that the script is still running.
How to obtain Concordances?
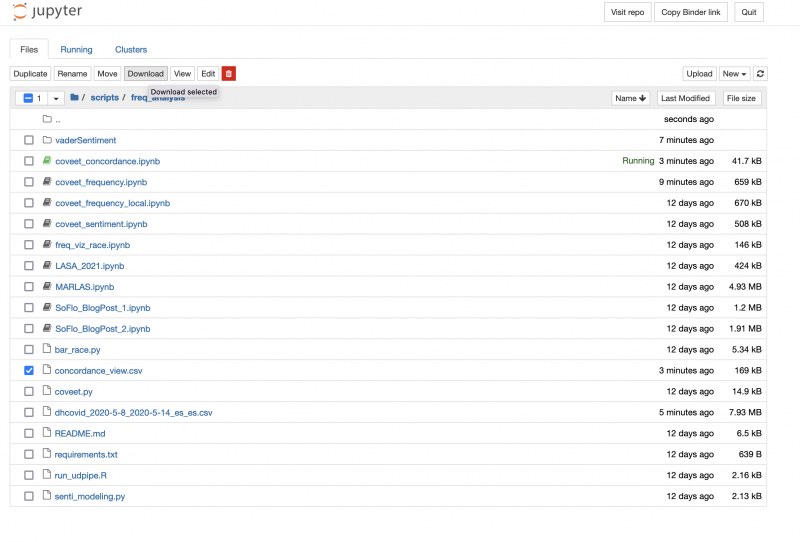
Once the Jupyter notebook is running in Binder, you just have to look for the Concordance script. To do so, you need to go up the tree of the repository by changing the URL, for example, if your current Binder URL is https://hub.gke2.mybinder.org/user/dh-miami-narratives_covid19-dh1w6ul9/notebooks/scripts/freq_analysis/coveet_frequency.ipynb you need to change it to https://hub.gke2.mybinder.org/user/dh-miami-narratives_covid19-dh1w6ul9/tree/
Then, you have to look for move to scripts/freq_analysis and open the coveet_concordance.ipynb:
You will have to change the dates, the region and the language that you are researching (line 3), for example, in my case should be: !python coveet.py query -g es -l es -d 2020-05-08 2020-05-14
You can ignore this line: !conda activate blueberry; python coveet.py query -g fl ar co ec es mx pe -l en es -d 2020-05-08 2020-05-14
Remember to substitute the file that you have created when doing the query: df = pd.read_csv(‘dhcovid_2020-5-8_2020-5-14_es_es.csv’, index_col=0)
Finally, to look for the terms you want modify the step 7:
And then you will be able to download your concordances in the file concordance_view.csv (go up to the tree and download it).
We are happy to finally launch the interface to download a collection of tweets related to the Covid-19 pandemic. You can choose a range date, an area (Mexico, Argentina, Colombia, Perú, Ecuador, Spain, Miami area), and language (only for the Miami area, in English and Spanish).
The texts are processed by removing accents, punctuations, mention of users (@users) to protect privacy, and replacing all links with “URL.” Emojis are transliterated into a UTF-8 charset and transformed into emojilabels. We also decided to unify all different spellings of Covid-19 under a unique form, and all other characteristics, including hashtags, are always preserved.
But there’s more! We have implemented a simple API to select your collection with no need to access to the interface.
The API entrance point is also here: https://covid.dh.miami.edu/get/ and it serves to deliver the .txt files that you want.
There are three main variables for queries and each query is separated by an ‘&’: language, geolocalization, and date. Each query starts always with a “?” and is abbreviated as follows:
lang = es or en
geo = fl, ar, es, co, pe, ec, mx, all
date: month-year-day, {month}-year-month, {year}-year, or a range ‘ {from}-year-month-day-{to}-year-month-day’
Here are some examples:
Tweets in English, from Florida, on April 24th: https://covid.dh.miami.edu/get/?lang=en&geo=fl&date=2020-04-24
Tweets in Spanish, from Florida, on April 24th: https://covid.dh.miami.edu/get/?lang=es&geo=fl&date=2020-04-24
Tweets in Spanish, from Colombia, on May 17th: https://covid.dh.miami.edu/get/?lang=es&geo=co&date=2020-05-17
All tweets in Spanish from Flroida: https://covid.dh.miami.edu/get/?lang=es&geo=fl&date=all
Tweets from Argentina from April 24th to 28th: https://covid.dh.miami.edu/get/?lang=es&geo=ar&date=from-2020-04-24-to-2020-04-28
All tweets from Spain during April: https://covid.dh.miami.edu/get/?lang=es&geo=es&date=month-2020-04
Please, have fun! 😉
Remember: if the file is not generated already in the database, it will take some minutes to be generated.
This post compares the top 30 most frequent words and the top 20 hashtags in our Twitter English and Spanish corpora of South Florida from April 25th to June 25th, 2020. We divided it into 2 four-week periods to analyze broad trends and themes in the discourse.
For our corpus criteria as well as for the keywords used to harvest our corpus, please refer to our blog post “A Twitter Dataset for Digital Narratives“. As for our corpus, check our GitHub repo for the ID datasets to recover tweets collections.
The project uses Coveet, a frequency analysis tool in Python developed by Jerry Bonnell, a PhD student in Computer Science at the University of Miami, that retrieves basic statistics (most frequent words, bigrams, trigrams, top users, hashtags, etc.). Coveet allows 1) customized stopword removal, 2) top words retrieval by date, location, and language, 3) mining unique top words by location and date, 4) collocation analysis, and 5) visualization.
We have prepared a version of this post with a Jupyter notebook in our GitHub repo that is available to be run via Binder.
As far as the number of tweets concerns, these are the totals in the South Florida area by month. As we can see, tweets in English are much frequent than in Spanish:
25/April – 25/May
25/May – 25/June
Tweets in Florida in Spanish:
6,695
4,957
Tweets in Florida in English:
23,548
18,867
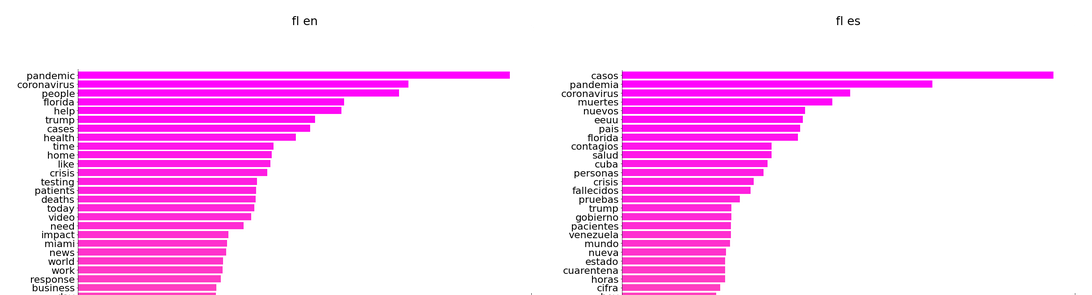
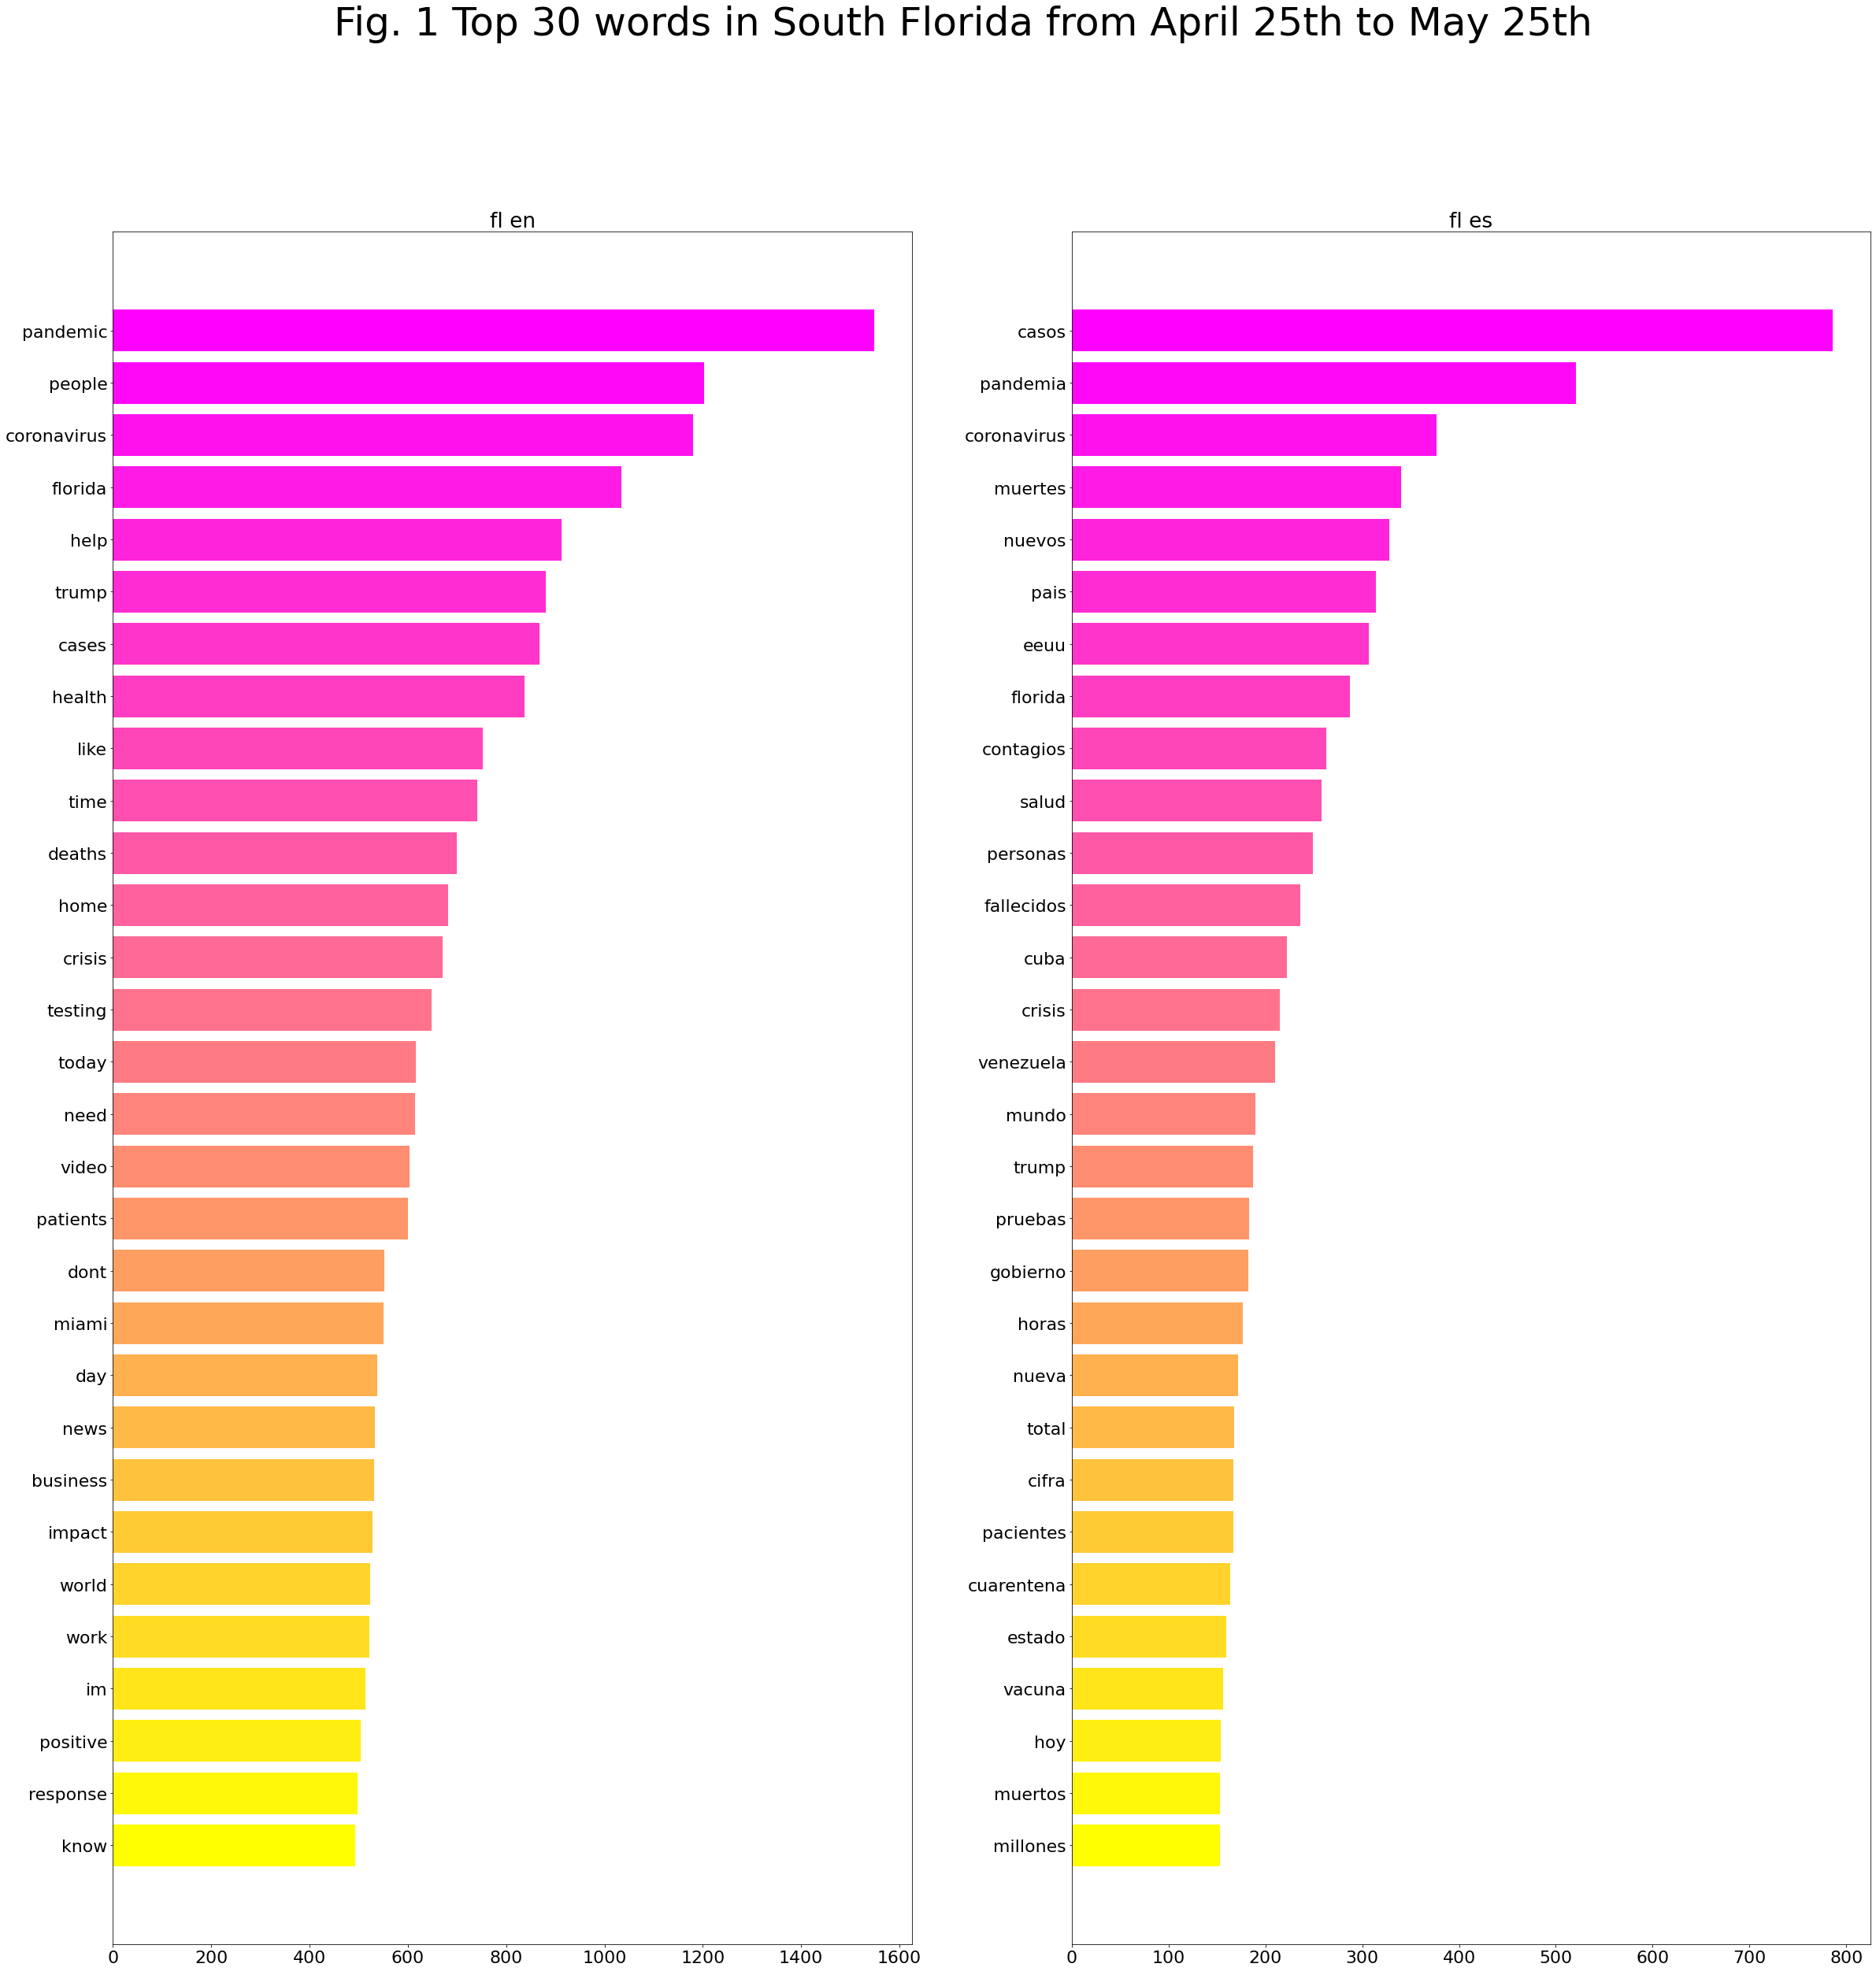
Top 30 words in South Florida from April 25th to May 25th: English vs Spanish
We will start this post by querying the tweets for the first four weeks from April 25 to May 25 in South Florida in both English and Spanish. We have prepared the dataset for interpretation, by removing stop words, which refers to the most common words in the language that appear so frequently that bear little significance. Removing stop words makes it easier to focus on the substantive discussions and themes in the corpus. There is not a standard list of stop words in each language. A few examples of stop words include “I,” “is,” “and,” etc. We have established our own list of stop words in our GitHub repo, for English and Spanish.
The process used for all periods is as follows: After the query is done [3], our coveet.py script, with the help of the pandas package, processes all commands in a csv file, which can be read via Excel and is downloadable and portable [4]. We then run a function consisting of tidying the csv data by removing the stopwords [5]. Afterward, we organize the resulting data by showing data, text, and hashtag, and to separate strings of texts into individual words (consequently a normal string such as “have a great days” is converted into “have” “a” “great” “day” [6] . We finally create the top ngrams and visualizations for each section [7].
Produced with coveet.py written by Jerry Bonnell.
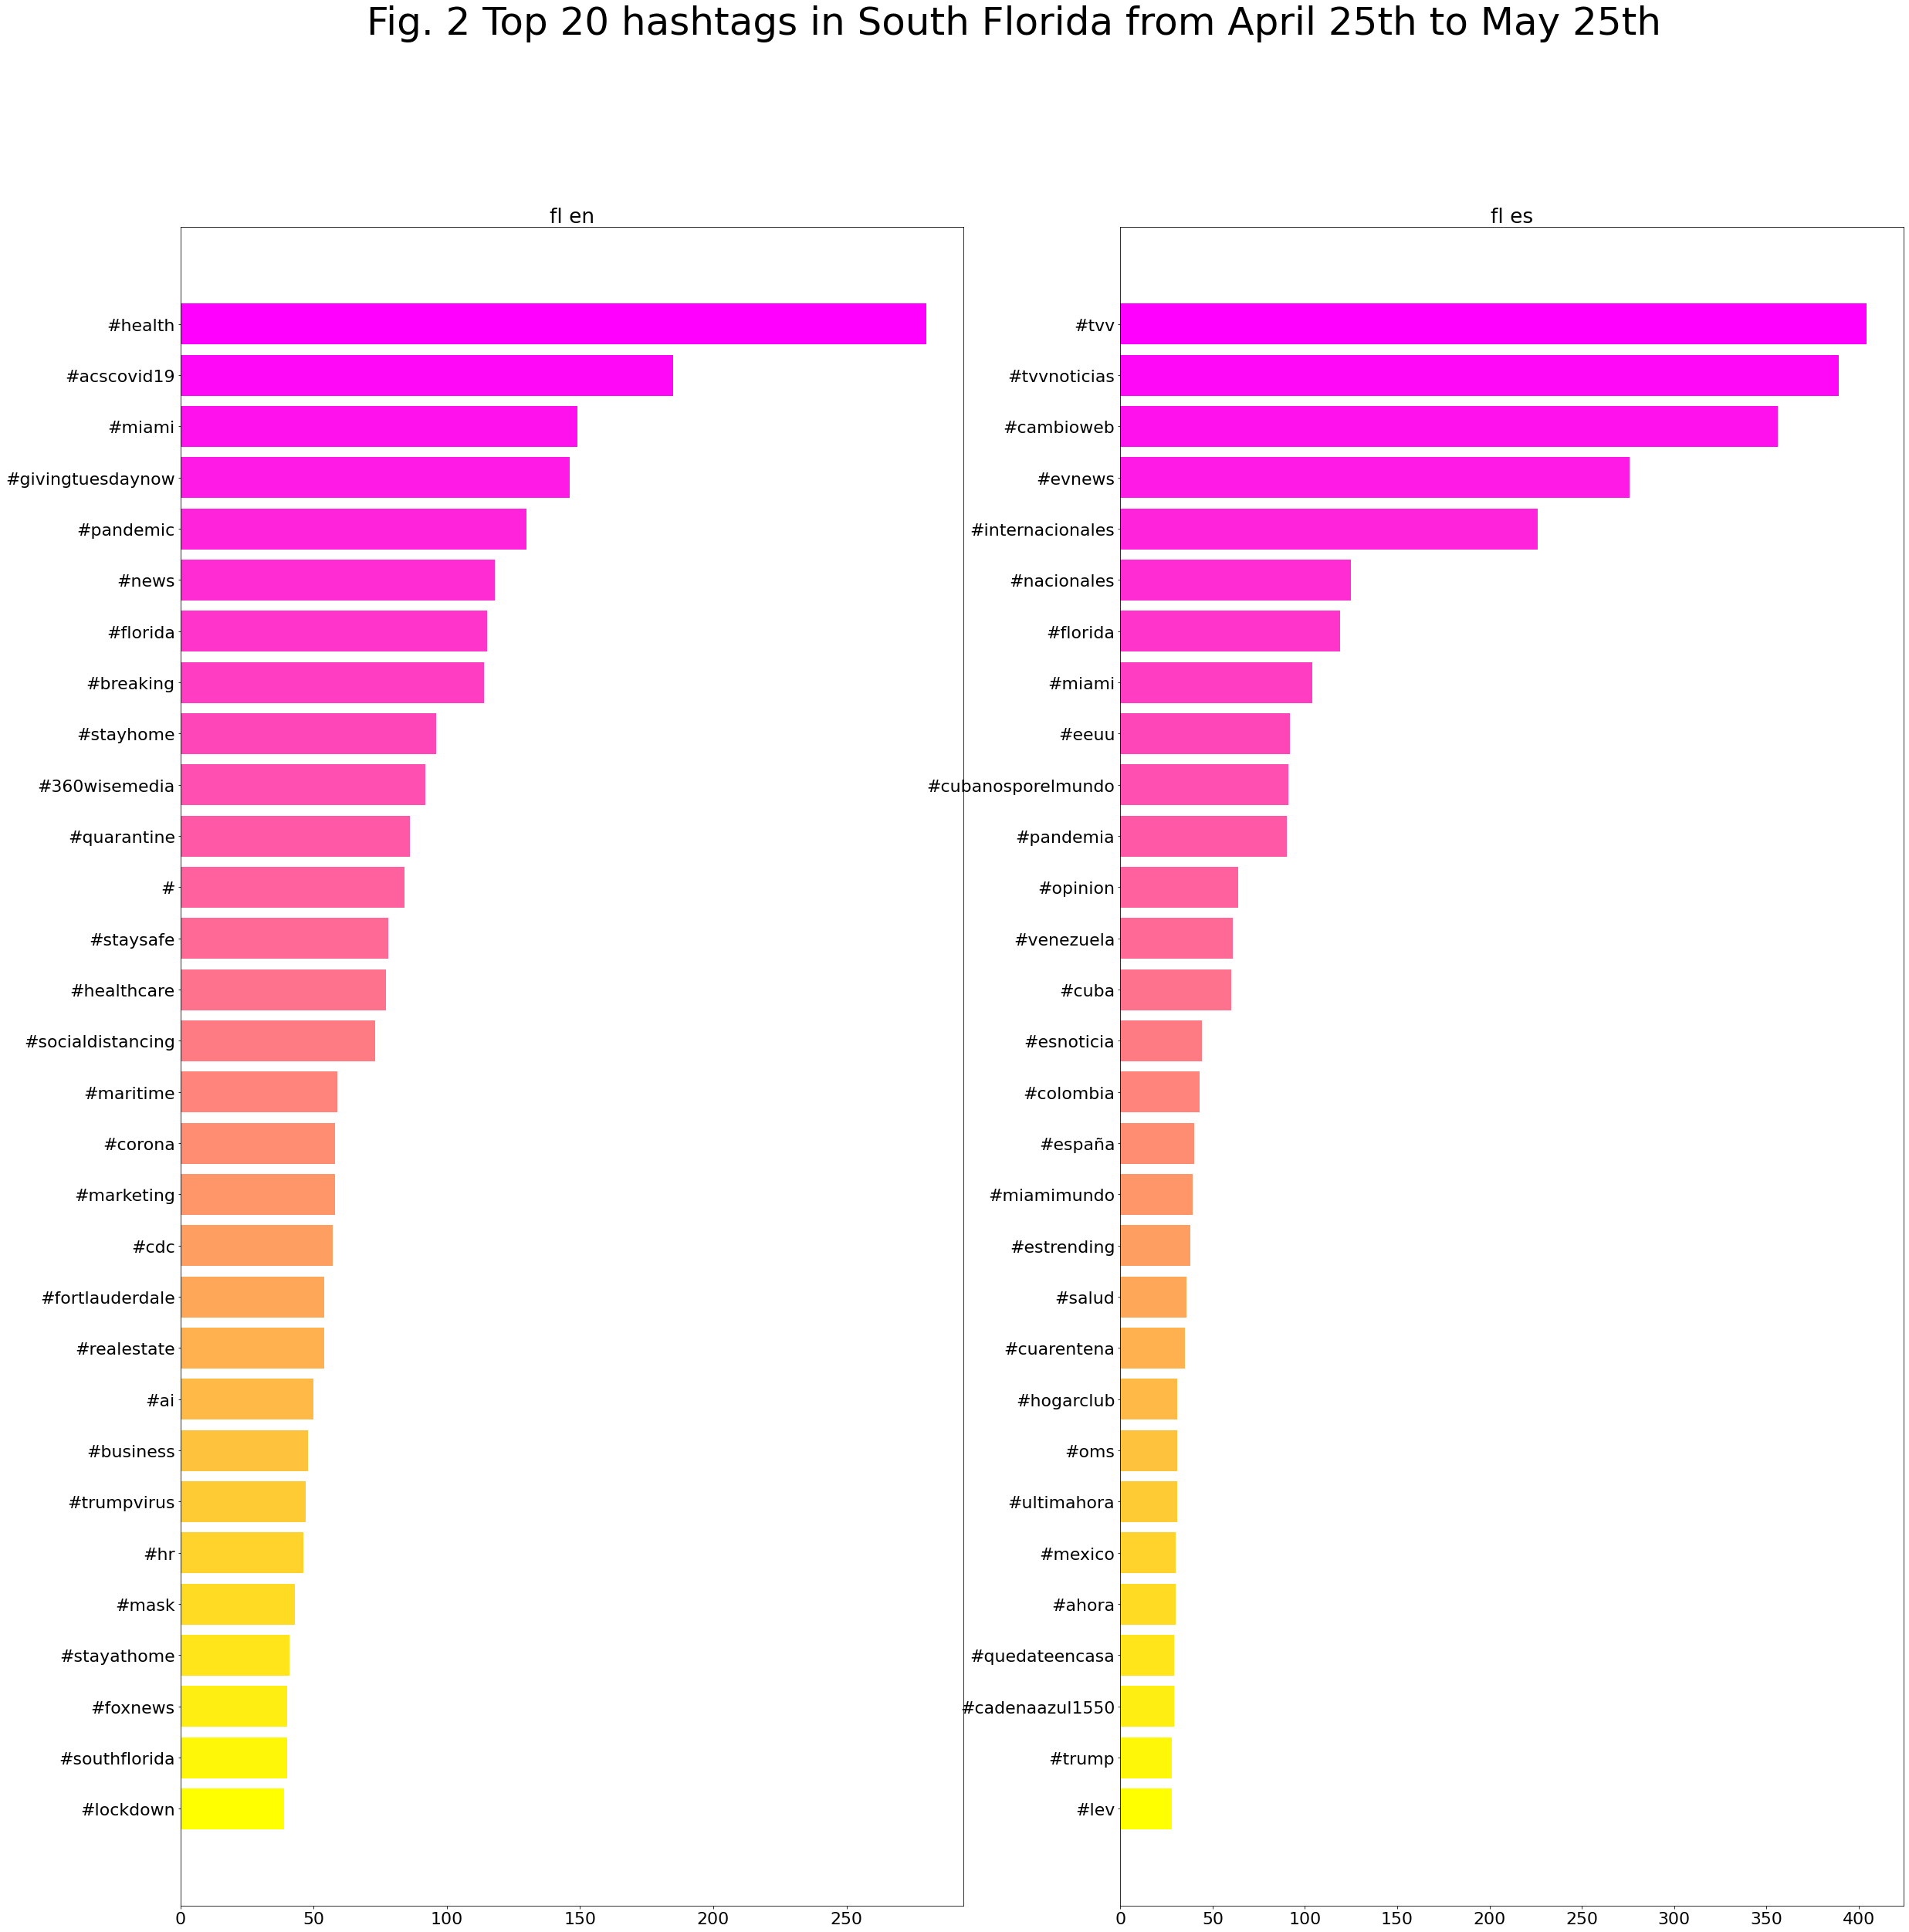
Top 20 hashtags South Florida from April 25th to May 25th: English vs Spanish
We have run the same process from April 25th to May 25th but recovering the 20 most used hashtags by language in South Florida.
Bar chart of 20 most frequent hashtags produced by coveet.py written by Jerry Bonnell.
English and Spanish discourses in South Florida both discuss daily new cases, infected patients, deaths, testing during this global crisis.
Comparing and contrasting the top words and hashtags points us to some interesting areas for further investigation.
The Spanish discourse seems more global. “eeuu,” “Cuba,” “Venezuela,” and “pais” suggest that the Spanish corpus discussed the pandemic on a national and international scale. “Miami,” a local term, on the other hand, is unique to the English corpus, whose top words don’t include any country names. Here are a few important questions to investigate:
Were foreign countries mentioned because of the large South Florida residents of Latin America, Cuba and Venezuela in particular, descent?
Did these Twitter users want to compare the situation in the US to those of other countries?
Why such international focus is more prominent in the Spanish corpus than the English corpus?
Public health measures are more prominent in the Spanish corpus. “Cuarentena” and “vacuna” shows that the discussions of quarantine policies and vaccine take a significant weight in Spanish-languaged tweets, which neither is discussed in the English corpus. How shall we explain this distinction?
The English corpus seems to be more “interactive.” “Help,” “need,” “support,” and “please” suggest a call for action from another individual, and are unique to the English corpus. These words imply that the English tweets have a stronger intention to interact with readers and influence others’ behaviors. With further concordance analysis, here are a few questions that come to mind
To whom are these actions directed? Government agencies, the audience at large, hospitals, etc.?
Are these demands for others, i.e. “people need to wear masks,” or calls for assistance for oneself, i.e. “my family needs support due to unemployment”?
Which topical area did these words mostly appear in, economics, medical, political, personal, etc?
“Business” and “work” are unique to the English corpus. Does it indicate more discussions about the economic effects of the pandemic?
Since “gobierno” is unique to the Spanish corpus, how prominent is government-related discussions in Spanish tweets? Does the English corpus discuss government, at all? How do they differ?
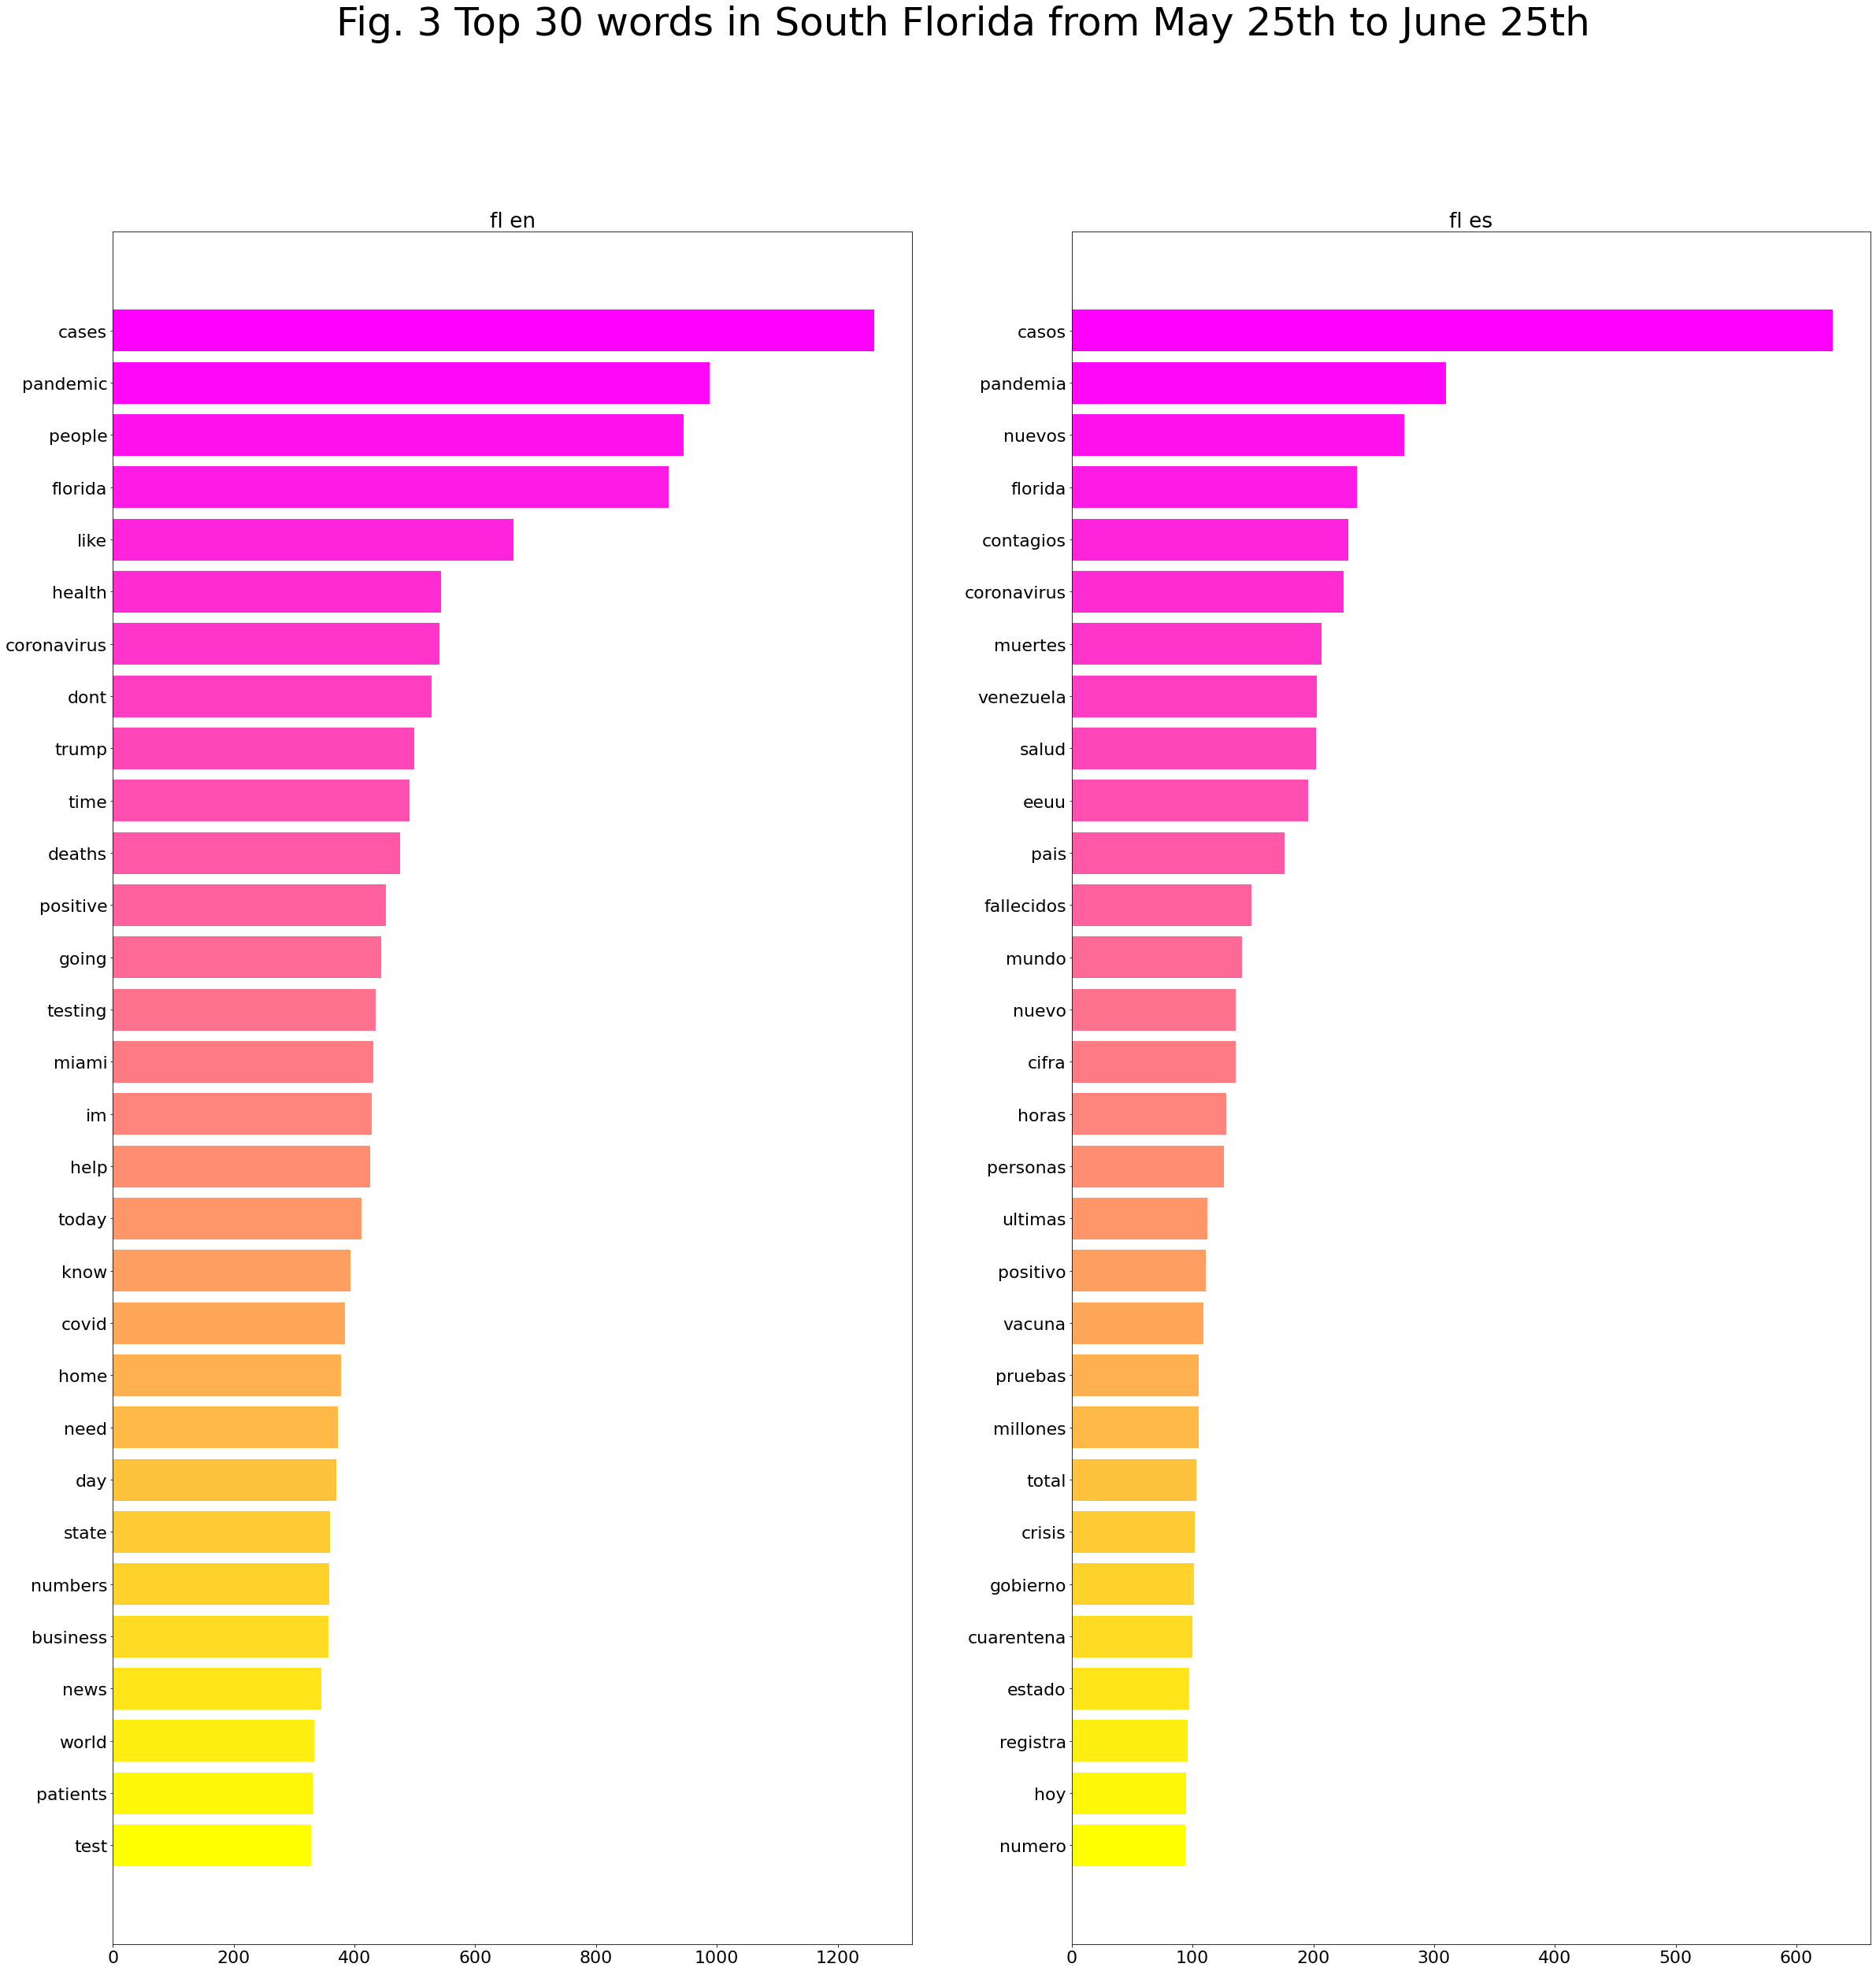
Top 30 words in South Florida from May 25th to June 25th: English vs Spanish
The same process now can be repeated for a second period, from May 25th to June 25th, and here are the top 30 words most used, after cleaning stopwords:
Produced with coveet.py written by Jerry Bonnell.
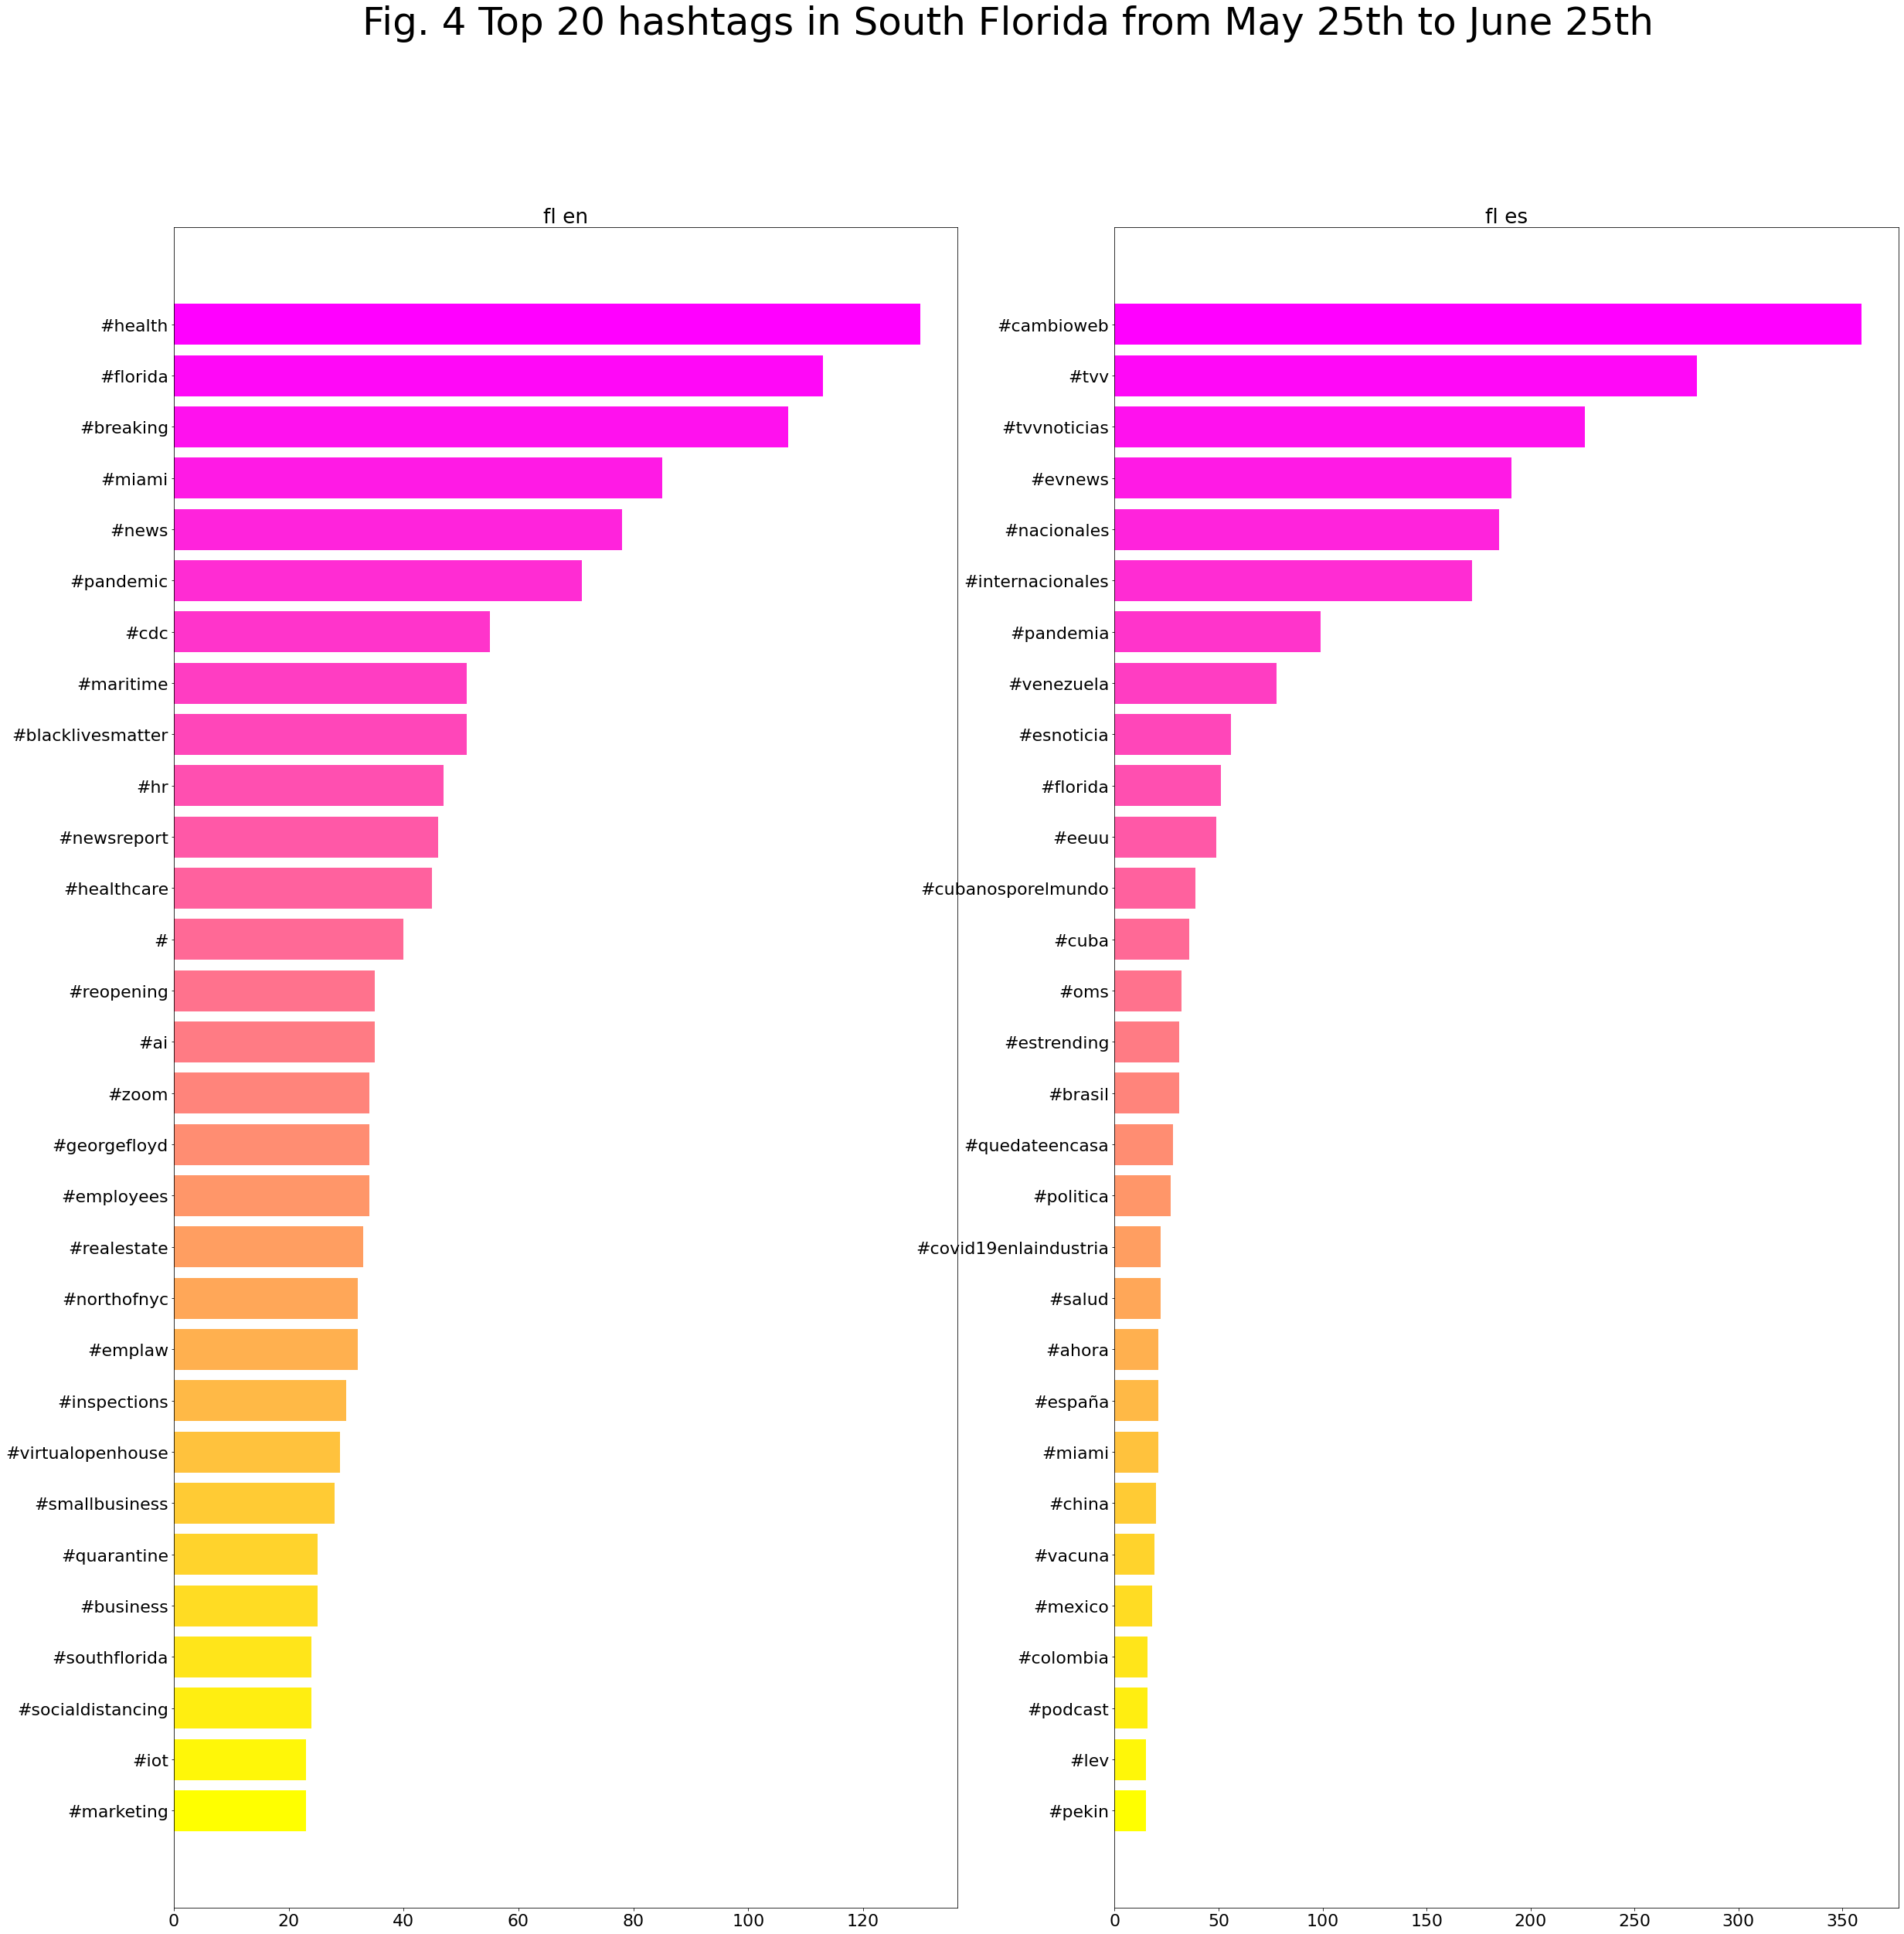
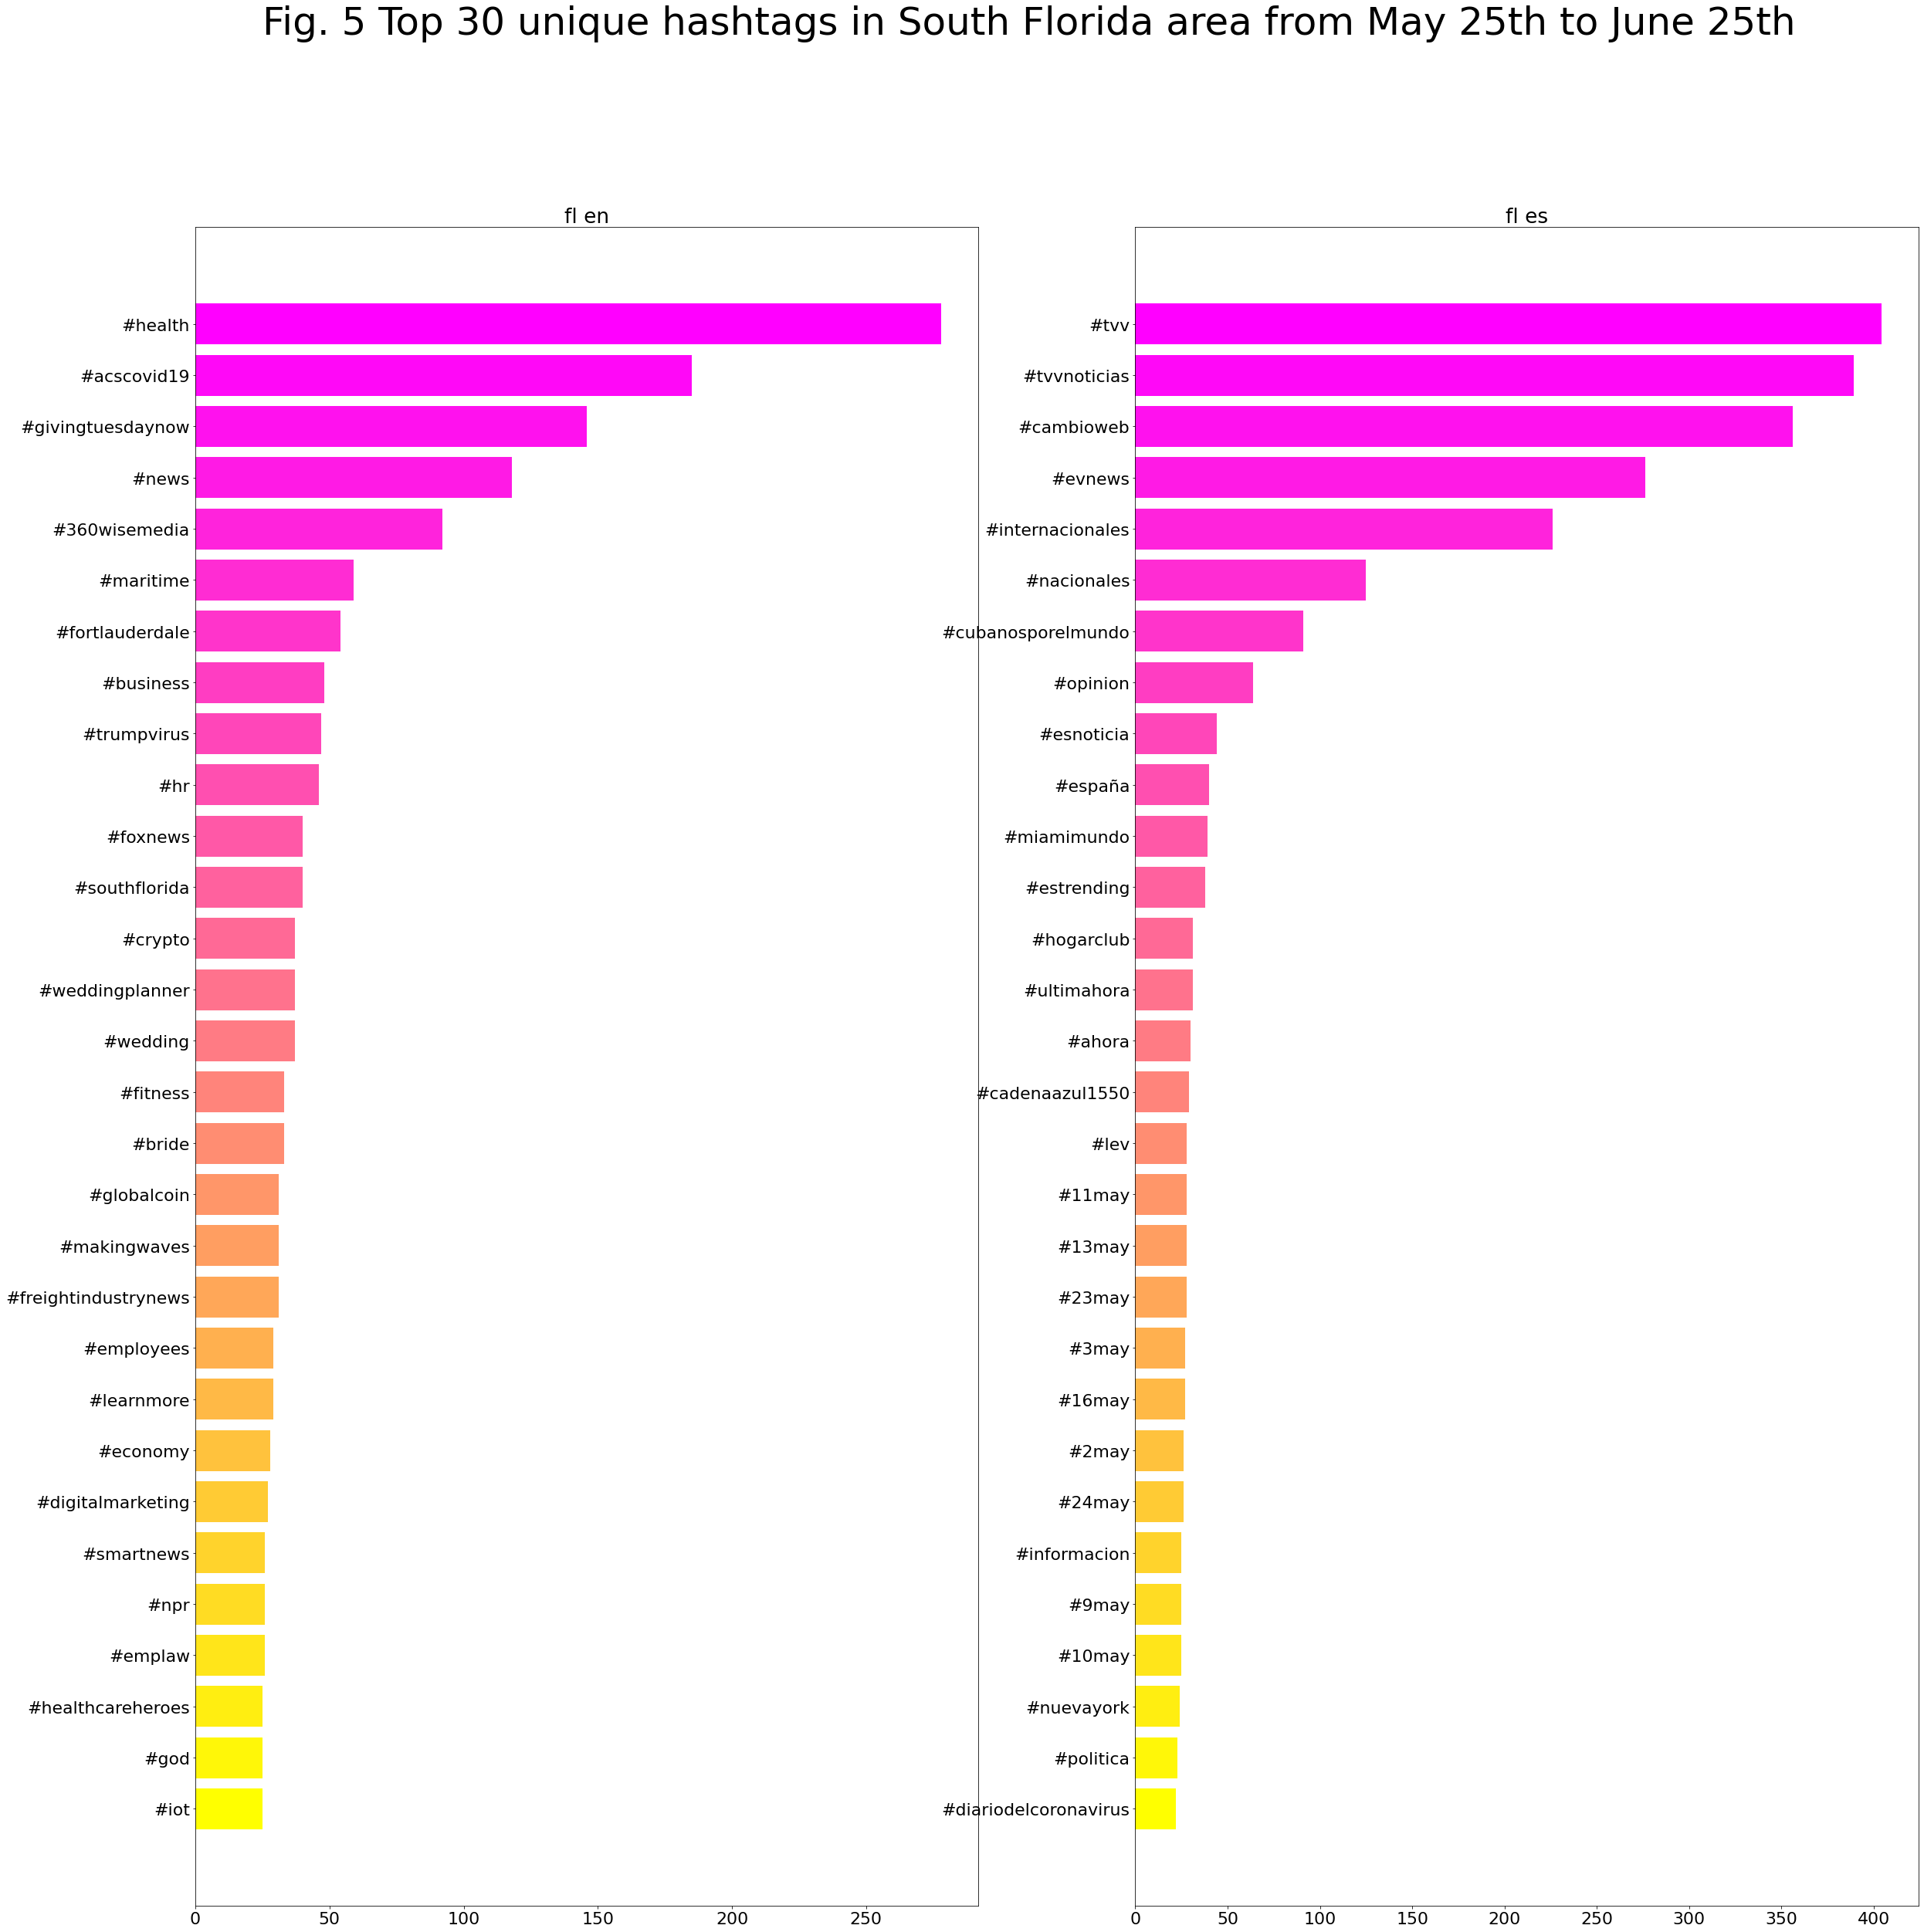
Top 20 hashtags South Florida from May 25th to June 25th: English vs Spanish
Also, here are a list of the most used hashtags in this period:
Produced with coveet.py written by Jerry Bonnell
Let’s first look at the common top words. With cases/casos and new/nuevo rising to top two, we can speculate more discussions about the increasing number of cases in South Florida after late May. “Miami” shows up in both English and Spanish corpora, indicating more attention paid to this area by Spanish-language Twitter users.
The list of unique words further reveals some patterns and research questions.
The Spanish corpus remains more “global.” Venezuela and Cuba are again hot topics among the Spanish-speaking population, but this time Venezuela appears first, with Brazil added to the list and China disappeared. As the situation of the countries worsen, they naturally rise to the upper position in the public conversations.
“Masks” is (finally) a top word in the English corpus. This aligns with various states’ mandatory mask policies, calls for responsible protesting during the Black Lives Matter movement, and reflects an improved public awareness of responsible preventive measures.
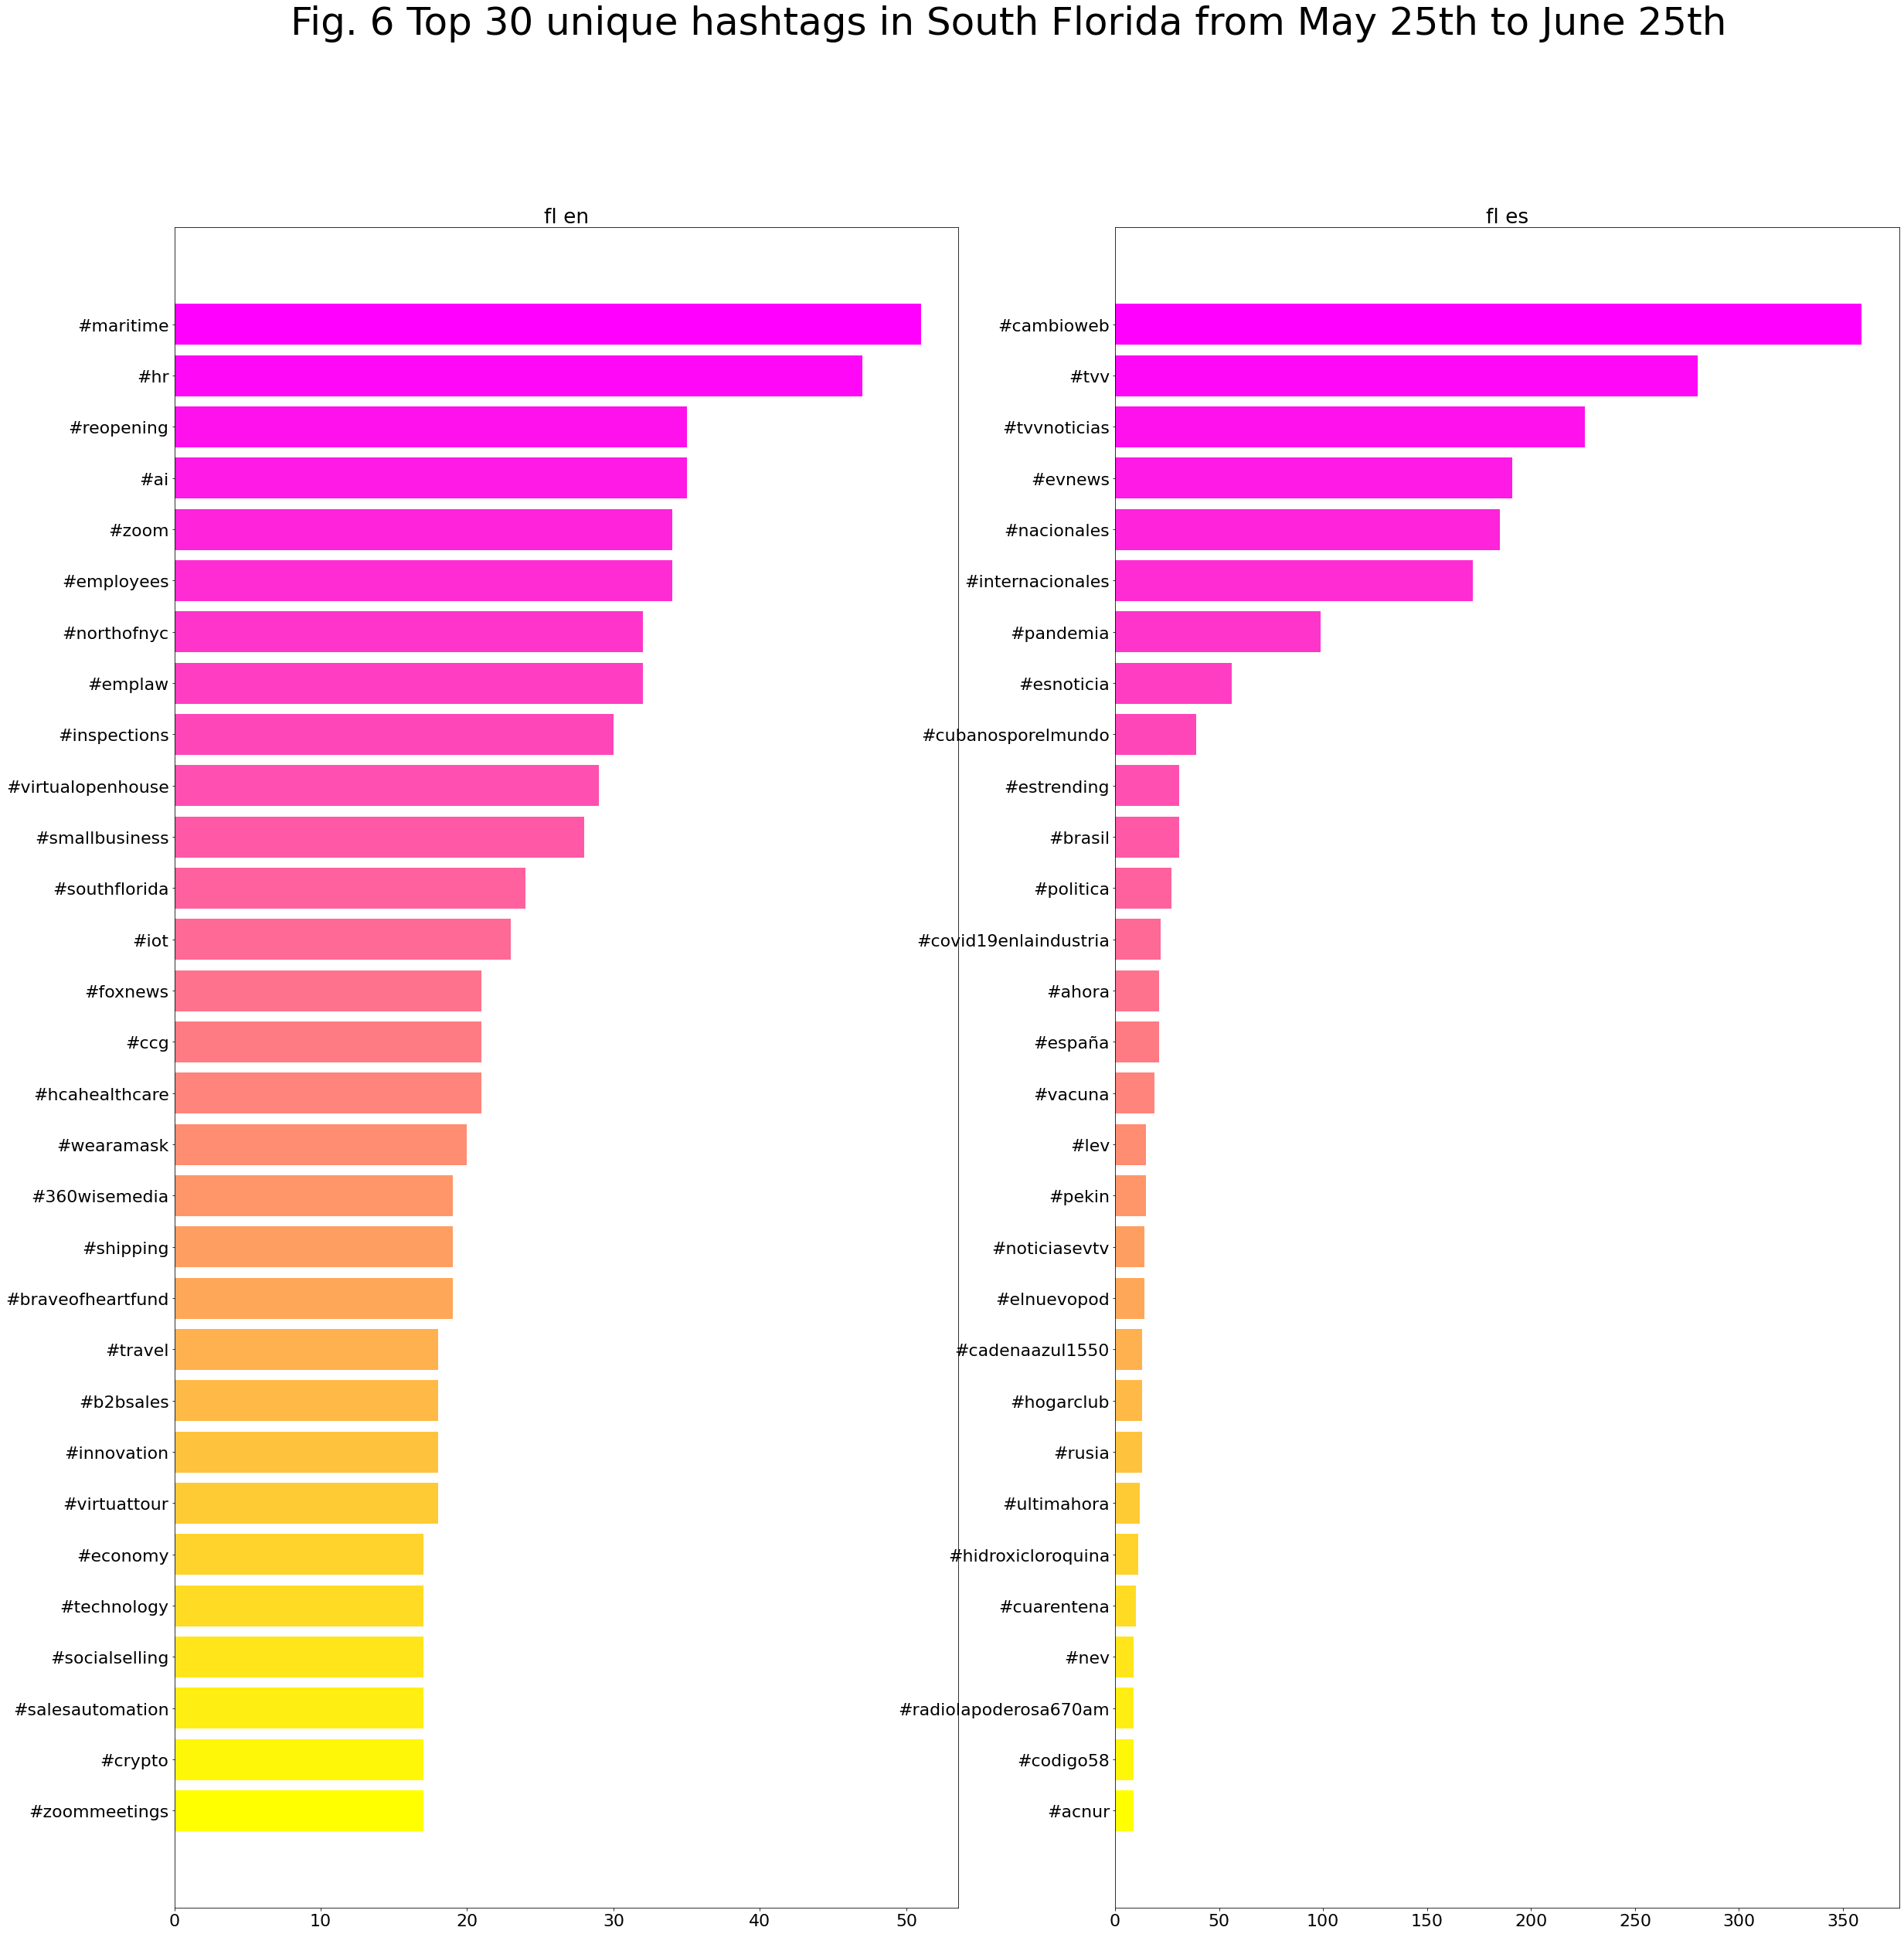
Top unique hashtags
It is also interesting to check the corpus looking only for unique hashtags that appear in English or in Spanish.
These are the top hashtags that appear in the fist period of time (April 25th to May 25th):
Produced with coveet.py written by Jerry Bonnell
While this plot bar shows the top unique hashtags from May 25th to June 25th:
Produced with coveet.py written by Jerry Bonnell
We hope, with this blog post, to have shown some more techniques on how to explore our Twitter corpus. Stay tuned for more functionalities and more thoughts about what people are saying about Covid-19 on social media.
A finales de abril empezamos a familiarizarnos con la API de Twitter y a preguntarnos cómo capturar las conversaciones públicas que están ocurriendo en esta red social.
Entendimos rápidamente que necesitábamos un plan y una metodología para organizar nuestro corpus, conseguir nuestros objetivos, y dividir las diferentes tareas entre los miembros del equipo.
Los conjuntos de datos en inglés son numerosos (véase la publicación “Minería de Twitter y datasets sobre la Covid-19” del 23 de abril de 2020). Para empezar con un corpus más definido, decidimos centrarnos en conjuntos de datos en español, en general y por áreas. También quisimos dar un tratamiento especial al área del sur de Florida y abordarla desde una perspectiva bilingüe, debido a su diversidad lingüística, especialmente en inglés y español. Con esto en mente, una parte del equipo analiza las conversaciones en inglés y español, centrándose en el área del sur de Florida y Miami. Mientras que el equipo de CONICET se encarga de explorar los datos en español, es decir, de Argentina.
Para ampliar nuestro conjunto de datos, hemos decidido cosechar también todos los tweets en español, y crear conjuntos de datos específicos para otras partes de América Latina (México, Colombia, Perú, Ecuador), y España. Para una mejor organización de nuestro corpus, creamos una base de datos relacional que colecta la información relacionada con tweets específicos e ingiere automáticamente cientos de miles de tweets al día.
Tenemos diferentes queries o búsquedas en marcha, que corresponden a los conjuntos de datos en nuestra carpeta ‘twitter-corpus‘ en GitHub. En resumen, hay tres tipos principales de búsquedas:
Búsqueda general para español cosechando todos los tweets que contienen los siguientes hashtags y palabras clave: covid, coronavirus, pandemia, cuarentena, confinamiento, quedateencasa, desescalada, distanciamiento social
Búsqueda específica para inglés en Miami y el sur de Florida. Los hashtags y las palabras clave cosechadas son: covid, coronavirus, pandemic, quarantine, stayathome, outbreak, lockdown, socialdistancing.
Búsquedas específicas con las mismas palabras clave y hashtags para español en Argentina, México, Colombia, Perú, Ecuador, España, utilizando la geolocalización del tweet cuando sea posible y/o la información del usuario
Las carpetas se organizan por día (YEAR-MONTH-DAY). En cada una hay 9 archivos de texto plano denominados “dhcovid”, seguidos de fecha (YEAR-MONTH-DAY), idioma (“en” para inglés y “es” para español), y abreviatura de región (“fl”, “ar”, “mx”, “co”, “pe”, “ec”, “es”):
dhcovid_YEAR-MONTH-DAY_es_fl.txt: Conjunto de datos que contiene tweets geolocalizados en el sur de Florida. La geolocalización es rastreada por las coordenadas del tweet, por el lugar o por la información del usuario.
dhcovid_YEAR-MONTH-DAY_en_fl.txt: Este archivo contiene solo tweets en inglés que refieren al área de Miami y el sur de Florida. Esta elección se debe a la existencia de múltiples proyectos que recogen datos en inglés, nuestro proyecto está particularmente interesado en esta área debido a nuestra institución de origen (Universidad de Miami) y porque pretendemos estudiar las conversaciones desde un punto de vista bilingüe (EN/ES).
dhcovid_YEAR-MONTH-DAY_es_ar.txt: Conjunto de datos que contienen tweets geolocalizados en Argentina (por georreferencia, por lugar o por usuario).
dhcovid_YEAR-MONTH-DAY_es_mx.txt: Conjunto de datos que contienen tweets geolocalizados en México (por georreferencia, por lugar o por usuario).
dhcovid_YEAR-MONTH-DAY_es_co.txt: Conjunto de datos que contienen tweets geolocalizados en Colombia(por georreferencia, por lugar o por usuario).
dhcovid_YEAR-MONTH-DAY_es_pe.txt: Conjunto de datos que contienen tweets geolocalizados en Perú (por georreferencia, por lugar o por usuario).
dhcovid_YEAR-MONTH-DAY_es_ec.txt: Conjunto de datos que contienen tweets geolocalizados en Ecuador (por georreferencia, por lugar o por usuario).
dhcovid_YEAR-MONTH-DAY_es_es.txt: Conjunto de datos que contienen tweets geolocalizados en España (por georreferencia, por lugar o por usuario).
dhcovid_YEAR-MONTH-DAY_es.txt Este conjunto de datos contiene todos los tweets en español, independientemente de su geolocalización.
Desde el 23 de mayo, tenemos un total de:
Español del sur de Florida (es_fl): 6,440 tweets
Inglés del sur de Florida (en_fl): 22,618 tweets
Español de Argentina (es_ar): 64,398 tweets
Español de Mexico (es_mx): 402,804 tweets
Español de Colombia (es_co): 164,613 tweets
Español de Peru (es_pe): 55,008 tweets
Español de Ecuador (es_ec): 49,374 tweets
Español de España (es_es): 188,503 tweets
Español (es): 2,311,482 tweets.
No incluimos los retweets, solo los tweets originales.
El corpus consiste en una lista de Tweet IDs. Una forma de obtener el tweet original es utilizando “hidratador de Twitter”, que toma el Id y descarga todos los metadatos en un archivo CSV.
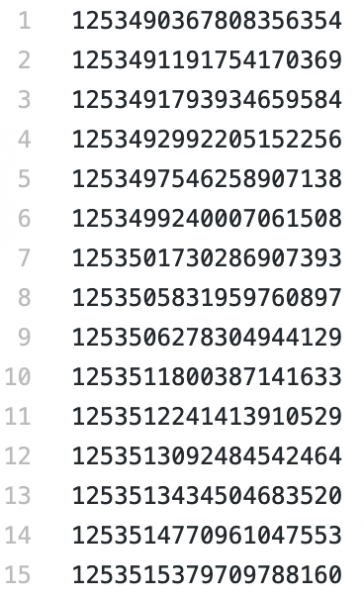
Figura 1. Captura de pantalla de una lista de tweets IDs.
Empezamos a recoger nuestros conjuntos de datos el 24 de abril de 2020. Para fechas anteriores (enero – 24 de abril), esperamos utilizar el conjunto de datos del PanaceaLab, debido a que es uno de los pocos que recoge datos en todos los idiomas, y esperamos conseguirlo en los próximos meses.
At the end of April we started to get familiarized with the Twitter API and asking how to capture the public conversations that are happening in this social media network.
We quickly understood we needed to focus on a plan and method for organizing our corpus, accomplishing our objectives, and dividing the different tasks among our team members.
Datasets in English are very numerous (see post “Mining Twitter and Covid-19 datasets” from April 23rd, 2020). In order to start with a more defined corpus, we decided to focus on Spanish datasets, in general and per areas. We also wanted to give a special treatment to the South Florida area and approach it from a bilingual perspective, due to its linguistic diversity, especially in English and Spanish. With this in mind, a part of the team analyzes public conversations in English and Spanish, and focuses on the area of South Florida and Miami. While the CONICET team is in charge to explore data in Spanish, namely from Argentina.
To enlarge our dataset, we have decided to harvest as well all tweets in Spanish, and to create specific datasets for other parts of Latin America (Mexico, Colombia, Perú, Ecuador), and Spain. For the sake of organization of our corpus, we built a relational database that collects all information connected to these specific tweets and that automatically ingest hundreds of thousands of tweets a day.
We have different queries running, which correspond to the datasets in our ‘twitter-corpus‘ folder in GitHub. In short, there are three main types of queries:
General query for Spanish harvesting all tweets which contain these hashtags and keywords: covid, coronavirus, pandemia, cuarentana, confinamiento, quedateencasa, desescalada, distanciamiento social
Specific query for English in Miami and South Florida. The hashtags and keywords harvested are: covid, coronavirus, pandemic, quarantine, stayathome, outbreak, lockdown, socialdistancing.
Specific queries with the same keywords and hashtags for Spanish in Argentina, Mexico, Colombia, Perú, Ecuador, Spain, using the tweet geolocalization when possible and/or the user information.
Folders are organized by day (YEAR-MONTH-DAY). In every folder there are 9 different plain text files named with “dhcovid”, followed by date (YEAR-MONTH-DAY), language (“en” for English, and “es” for Spanish), and region abbreviation (“fl”, “ar”, “mx”, “co”, “pe”, “ec”, “es”):
dhcovid_YEAR-MONTH-DAY_es_fl.txt: Dataset containing tweets geolocalized in South Florida. The geo-localization is tracked by tweet coordinates, by place, or by user information.
dhcovid_YEAR-MONTH-DAY_en_fl.txt: This file contains only tweets in English that refer to the area of Miami and South Florida. The reason behind this choice is that there are multiple projects harvesting English data, and, our project is particularly interested in this area because of our home institution (University of Miami) and because we aim to study public conversations from a bilingual (EN/ES) point of view.
dhcovid_YEAR-MONTH-DAY_es_ar.txt: Dataset containing tweets geolocalized (by georeferences, by place, or by user) in Argentina.
dhcovid_YEAR-MONTH-DAY_es_mx.txt: Dataset containing tweets geolocalized (by georeferences, by place, or by user) in Mexico.
dhcovid_YEAR-MONTH-DAY_es_co.txt: Dataset containing tweets geolocalized (by georeferences, by place, or by user) in Colombia.
dhcovid_YEAR-MONTH-DAY_es_pe.txt: Dataset containing tweets geolocalized (by georeferences, by place, or by user) in Perú.
dhcovid_YEAR-MONTH-DAY_es_ec.txt: Dataset containing tweets geolocalized (by georeferences, by place, or by user) in Ecuador.
dhcovid_YEAR-MONTH-DAY_es_es.txt: Dataset containing tweets geolocalized (by georeferences, by place, or by user) in Spain.
dhcovid_YEAR-MONTH-DAY_es.txt This dataset contains all tweets in Spanish, regardless of its geolocation.
As of today May 23rd, we have a total of :
Spanish from South Florida (es_fl): 6,440 tweets
English from South Florida (en_fl): 22,618 tweets
Spanish from Argentina (es_ar): 64,398 tweets
Spanish from Mexico (es_mx): 402,804 tweets
Spanish from Colombia (es_co): 164,613 tweets
Spanish from Peru (es_pe): 55,008 tweets
Spanish from Ecuador (es_ec): 49,374 tweets
Spanish from Spain (es_es): 188,503 tweets
Spanish (es): 2,311,482 tweets
We do not include retweets, only original tweets.
The corpus consists of a list of Tweet Ids. As a way of obtaining the original tweets, you can use the “Twitter hydratator” which takes the id and download for you all metadata in a csv file.
Fig. 1. Screenshot of a list of tweets ids.
We started collecting our dataset on April 24th, 2020. For prior dates (January – April 24th), we hope to use the PanaceaLab dataset, since it is one of the few that collects data in all languages, and we expect achieve this in the next couple of months.
El único tema en estos días: el coronavirus, Covid-19, la pandemia, SARS, la crisis, la enfermedad, el enemigo, la supervivencia… Todos estamos bajo la misma situación global y preocupados por los impactos y consecuencias que este evento está teniendo y tendrá en nuestras vidas.
Asimismo, esta pandemia puede ser abordada desde infinitas perspectivas, por ello, creemos que las Humanidades Digitales pueden contribuir. Nuestro principal interés se centra en las narrativas digitales que emergen de este brote. ¿Cuáles son las narrativas entorno a la pandemia? Ciertamente, no son únicas ni monolíticas.
El distanciamiento social pone en primera línea a las redes sociales, algunas de ellas están abiertas a la minería y a la recuperación de lo que la gente está diciendo. El mejor ejemplo de ello es Twitter, que posee una API para recuperar tweets, que contienen los textos e interacciones sociales. Numerosos investigadores y proyectos ya están minando datos sobre la Covid-19 y proporcionando conjuntos de datos de tweets para ser descargados y explorados. Aquí tienes una lista de estos conjuntos de datos:
“Covid-19 Twitter chatter dataset for scientific use” (Panacea Lab) es un conjunto de datos en línea, almacenado en GitHub y distribuido con un DOI de Zenodo (la versión numérica se actualiza casi cada semana). Recogen datos desde el 27 de enero y en todos los idiomas, pero –como explican– los de mayor prevalencia son: inglés, español y francés. Presentan los conjuntos de datos en dos formatos diferentes: uno que contiene todas las menciones y los retweets, mientras que el otro es una versión limpia que solo contiene los tweets. También realizan tareas de PLN, proporcionando las 1.000 palabras más frecuentes y las principales ocurrencias. Complementan su conjunto de datos construyendo estadísticas generales. Este corpus –tal como lo establecen los Términos de servicio de Twitter– consiste en una lista de identificadores de tweets (Tweet IDs), que necesitan ser hidratados. Puede consultar también las publicaciones electrónicas publicadas en arXiv “A large-scale COVID-19 Twitter chatter dataset for open scientific research – an international collaboration”.
COVID-19-TweetIDs (E.Chen, K. Lerman y E. Ferrara) es otra colección en curso de tweets asociados con la pandemia. Comenzaron a reunir datos el 28 de enero. Ellos además de recolectar hashtags, utilizan la API de streaming de Twitter para rastrear cuentas de usuario específicas y palabras clave concretas. Han estructurado su repositorio GitHub por mes, día y hora. Cada carpeta de mes contiene un archivo .txt por día y hora con los Tweet IDs, estos deben ser hidratados. Consulta las publicaciones de arXiv “COVID-19: The First Public Coronavirus Twitter Dataset”.
“Coronavirus Tweet Ids” (D. Kerchner y L. Wrubel) contiene los Tweet IDs de 155.206.805 Tweets relacionados con el Coronavirus. Su fecha de inicio fue el 3 de marzo de 2020 y publican una nueva versión cada dos semanas aproximadamente. Para construir las colecciones utilizan el Social Feed Manager.
“Corona Virus (COVID-19) Tweets Dataset” (R. Lamsal) provee un conjunto de datos en CSV con losTweet IDs. Esta iniciativa monitorea en tiempo real la actividad en Twitter siguiendo solo los tweets en inglés “en”, y las palabras “corona”, “covid”, “covid-19”, “coronavirus” y las variantes de “sars-cov-2”. Simultáneamente, tienen sentiment.live, un sitio que visualiza el análisis de los sentimientos del feed de Twitter.
Hay muchos otros catálogos, proyectos y repositorios que reúnen colecciones de Twitter. Recomendamos también que eches un vistazo a:
y que visites el impactante Covid-19 Dashboard, que permite rastrear el número de casos en todo el mundo.
En este auge de datos, nuestro proyecto Narrativas digitales de la Covid-19 también busca crear un conjunto de datos de Twitter concebido bajo estos criterios:
Por lengua: inglés, español
Por región: Sur de Florida, Miami
Por fecha: 27 de enero –
Por hashtags (covid, covid-19, coronavirus, etc.)
Somos algo novatos en el uso de estas técnicas, así que tened paciencia mientras publicamos tutoriales sobre cómo lo estamos haciendo, y ¡únete a nosotros!
The only topic these days: the coronavirus, Covid-19, the pandemic, SARS, the crisis, disease, the enemy, the survival… We all are under the same global situation and we all are concerned by the many impacts and consequences that this event is having and will have in our lives.
This pandemic can be approached from infinite perspectives, and we think that digital humanities can also contribute. We are especially interested in the digital narratives that inform the outbreak. Which are the outbreaks narratives? Certainly, they are not unique or monolithic.
Social distancing brings to the frontline social media, some of which are open for mining and retrieving what people are saying. The most clear example is Twitter that has an API to recover tweets, containing texts and social interactions. Many scholars and projects are already mining data about Covid-19 and providing tweet datasets to be downloaded and explored. Here you have a list of these datasets:
“Covid-19 Twitter chatter dataset for scientific use” (Panacea Lab) is an online Data set, stored in GitHub and distributed under a DOI with Zenodo (the number version is updated almost every week). They gather data since January 27th and they capture all languages, but -as they explain- the higher prevalence are: English, Spanish, and French. They deliver the datasets in two different forms: one dataset contains all mentions and retweets, while the other is a clean version containing only the tweets. They also perform NLP tasks and provide the top 1,000 frequent words and top concurrencies. They complement their dataset by building general statistics. This corpus -as it is established by Twitter Terms of service– consists of a list of tweets identifiers, which need to be hydrated. Check also their e-prints posted on arXiv “A large-scale COVID-19 Twitter chatter dataset for open scientific research — an international collaboration“.
COVID-19-TweetIDs (E.Chen, K. Lerman, and E. Ferrara) is another ongoing collection of tweets associated with the pandemic. They commenced gathering data on January 28th. In their particular case, besides harvesting hashtags, they use Twitter’s streaming API to track specified user accounts and specific keywords. They have structured their GitHub repository by month, day, and hour. Each month folder contains a .txt file per day and hour. These .txt files also consist of the Tweet IDs and thus need to be hydrated. Check also their e-prints posted on arXiv “COVID-19: The First Public Coronavirus Twitter Dataset.”
“Coronavirus Tweet Ids” (D. Kerchner, L. Wrubel) contains the tweet ids of 155,206,805 tweets related to Coronavirus. Their starting date was between March 3, 2020 and they keep releasing a new version every two weeks approximately. To build the collections they use Social Feed Manager.
“Corona Virus (COVID-19) Tweets Dataset” (R. Lamsal) provides a CSV dataset with the tweet ids. This initiative monitors the real-time Twitter feed by tracking only English “en”, and the words “corona”, “covid”, “covid-19”, “coronavirus” and the variants of “sars-cov-2”. Simultaneously, they have sentiment.live, a site that visualizes sentiment analysis of the Twitter feed.
There are many other catalogs, projects, and repositories that gather Twitter collections. We recommend also to have a look here: